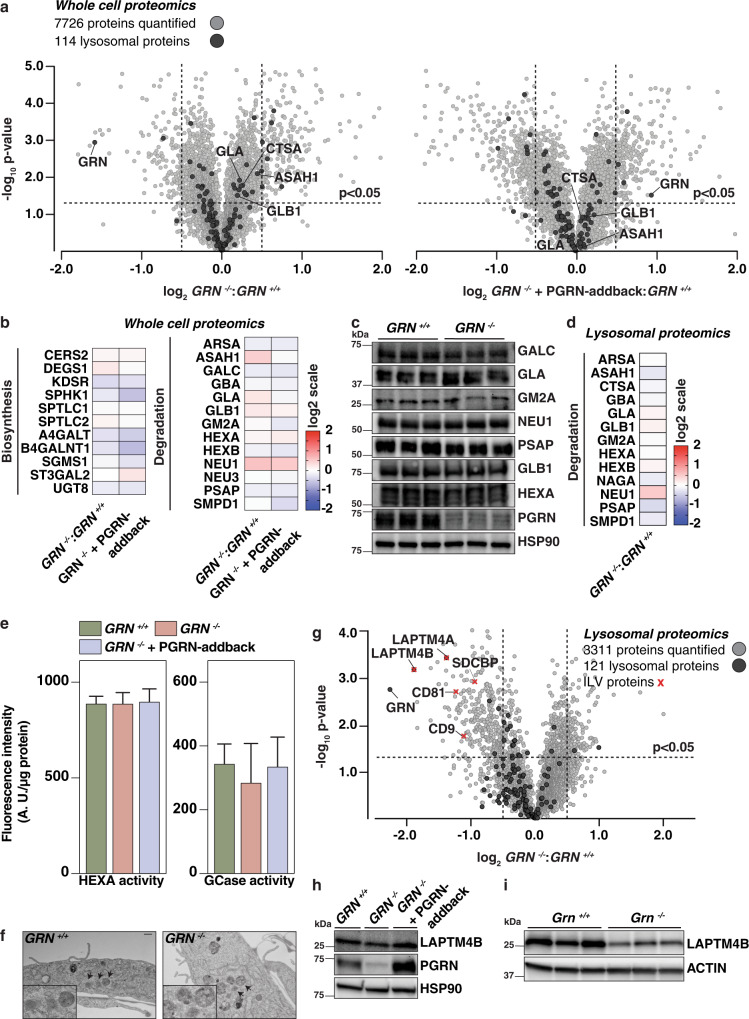
Fig. 3. TMT-quantitative proteomic and in vitro analyses show no major differences in abundances or activities of glycosphingolipid metabolic enzymes in cells with PGRN depletion.
a Volcano plot representation of whole-cell proteomes of GRN−/− (left) and GRN−/− + PGRN-addback (right) plotted against GRN+/+ with log2-fold-change (ratio of relative abundance, x-axis) and -log10 p-value (y-axis). All proteins (gray) and lysosomal proteins (black) quantified are shown. A corrected p-value < 0.05 (Welch’s test, two-sided) was used to calculate statistically significant differences between genotypes. b Heat map analysis of the relative abundance of a subset of proteins from whole-cell extracts that are involved in glycosphingolipid biosynthesis and degradation. c Western blotting analysis of proteins that are involved in glycosphingolid degradation (n = 3). d Heat-map analysis of the relative abundance of a subset of proteins that are involved in glycosphingolipid degradation from isolated lysosomal extracts. e HEXA and GCase activities were assessed in GRN+/+ (green), GRN−/− (orange), and GRN−/− + PGRN-addback (blue) cells when incubated with artificial substrates (n = 4 with three technical replicates each, mean ± SD). One-way ANOVA, followed by multigroup comparison (Dunn’s) test, was performed. *p < 0.05, **p < 0.01, or ***p < 0.001. f Electron micrographs from GRN+/+ and GRN−/− cells with lysosomes and ILVs indicated by arrows. Scale bar, 500 nm. g Volcano plot representation of lysosomal proteomes of GRN−/− plotted against GRN+/+ with log2-fold-change (ratio of relative abundance, x-axis) and −log10 p-value (y-axis). All proteins (gray), lysosomal proteins (black), and ILV-associated proteins (red) quantified are shown. A corrected p-value < 0.05 (Welch’s test, two-sided) was used to calculate statistically significant differences between genotypes. h, i Western blotting analysis of abundance of LAPTM4B in whole-cell extracts and mouse brains from different genotypes (n = 3).

