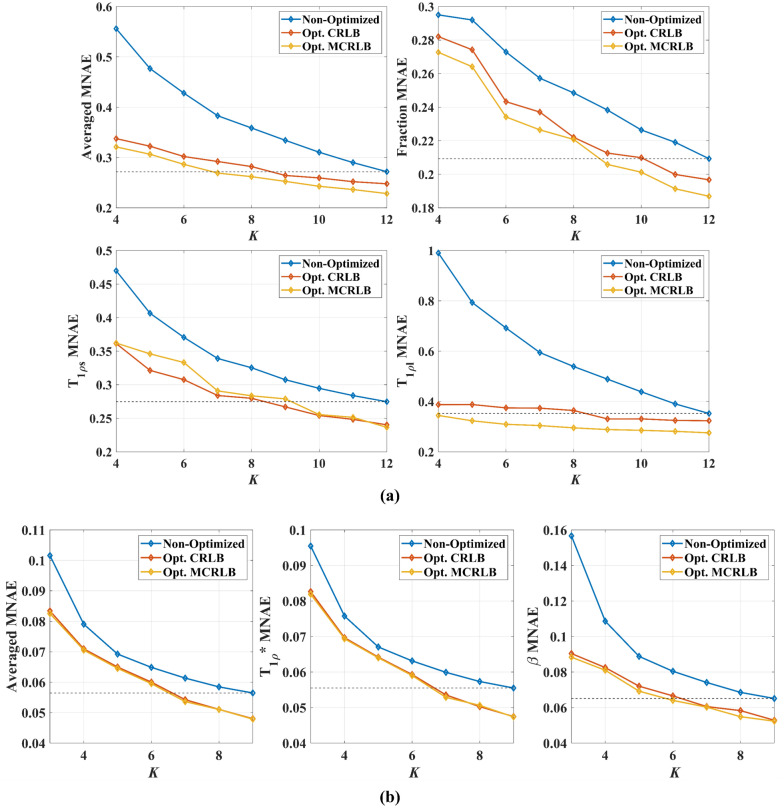
Figure 1.
A weighted average of MNAE (a) for estimated bi-exponential parameters, MNAE for the fraction, short T1ρ, and long T1ρ versus K. The optimized sampling schedules resulted in lower errors for the entire range, and the MCRLB optimized schedule was the top performer. Interestingly, the CRLB schedule performed better for the estimation of long T1ρ. This is probably due to the longer TSLs employed. In (b) Weighted average of MNAE for estimated stretched-exponential parameters, MNAE for the T1ρ*, and β versus K. Errors are much lower than for the bi-exponential model, and so is the gain over the non-optimized schedule. The differences between CRLB and MCRLB schedules also become smaller. The black dashed line indicates the minimum error obtained using the non-optimized schedule. The optimized schedules can reach this line before the non-optimized schedules, leading to lower acquisition times.

