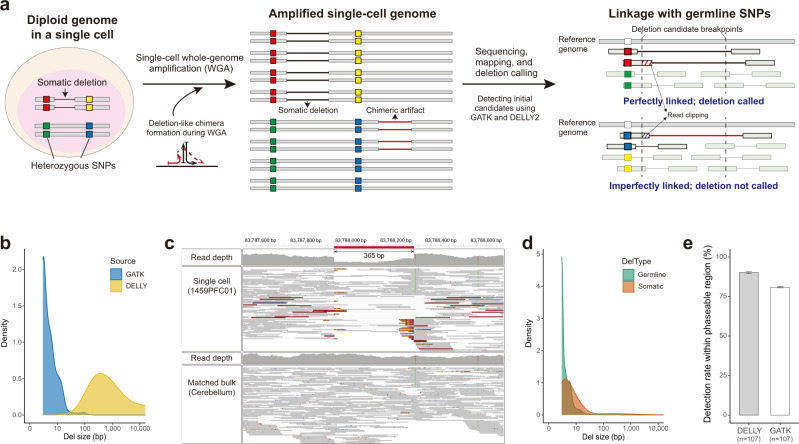
Fig. 1. Linkage-based detection of somatic deletions in single-cell WGS data.
a Schematic of PhaseDel. A true somatic deletion (black line) shows complete linkage with one allele (red) of a nearby heterozygous SNP whereas a deletion-like amplification artifact (red line) shows incomplete linkage with a nearby SNP allele (blue). PhaseDel utilizes raw calls from GATK and DELLY2 methods and makes final calls based on the linkage patterns of the initial deletion candidates. Box filled with diagonal lines represents clipped part of the read. b Deletion size distribution of two initial callers, GATK and DELLY2. c Integrative Genomics Viewer (IGV) screenshots of an example somatic deletion of 365 bp identified by PhaseDel. Upper and lower tracks demonstrate mapped reads from single-cell and bulk WGS data from the same individual, respectively. A reference allele of a heterozygous SNP on the right side of the deletion (red bar in the read depth track and no display in the WGS track) shows perfect linkage with the deletion-supporting reads (e.g., clipped reads). The deleted genomic region clearly shows a read depth decrease. d The size of somatic and germline deletions detected from 107 single neurons of 18 normal individuals. e The fraction of gold-standard germline deletions in phaseable regions detected by PhaseDel. n, number of single neurons; bar graph, mean ± 95% confidence interval (CI). Source data are provided as a Source Data file.

