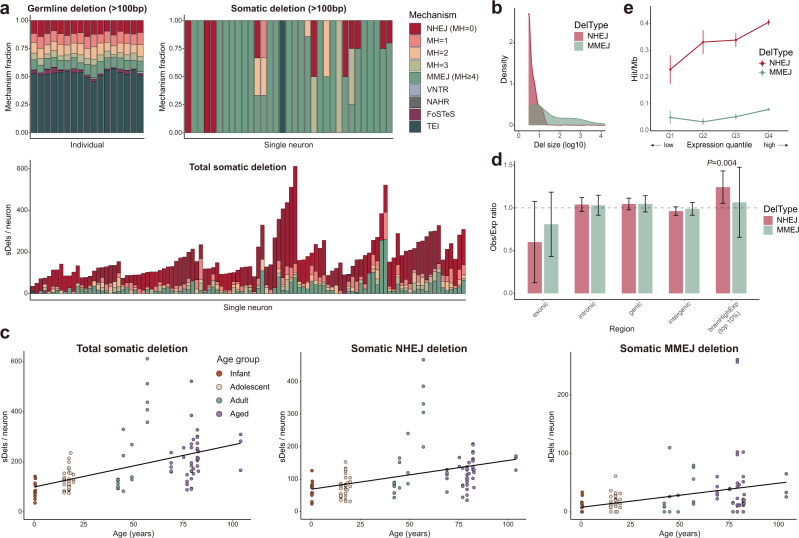
Fig. 3. Somatic nanodeletions in single-neurons increase with age and reflect distinctive underlying repair mechanisms.
a Contributions of the predicted mechanisms to deletion formation: germline deletions (>100 bp) per individual (upper left, 18 individuals), somatic deletions (>100 bp) per cell (upper right, 31 cells), and total somatic deletions per cell (lower, 107 cells). Individuals and single neurons are presented in order of age and deletion rate within each individual. Single cells with all deletions <100 bp are omitted in the upper right panel. Detailed criteria for mechanism prediction are described in Methods. MH microhomology. b The size of NHEJ- and MMEJ-based somatic deletions. c Somatic deletion counts by age with linear regression lines. Each point represents a single neuron. Total (left), NHEJ-based (MH = 0, middle), and MMEJ-based (MH ≥ 4, right) somatic deletions all showed a significant increase with age (P = 3.3 × 10⁻⁶, 4.78 × 10⁻⁵, 1.44 × 10⁻³; linear mixed model). d Enrichment of somatic deletions in different genomic regions. Y axis represents the ratio of somatic deletion counts for each category to expected counts from simulation. n = 1000 independently simulated sets; bar graph, mean ± 95% CI; empirical P = 0.004. e Somatic deletion burden by gene expression quantile in normal PFC. n = 1000 bootstrap deletion sets; mean ± SEM. Source data are provided as a Source Data file.

