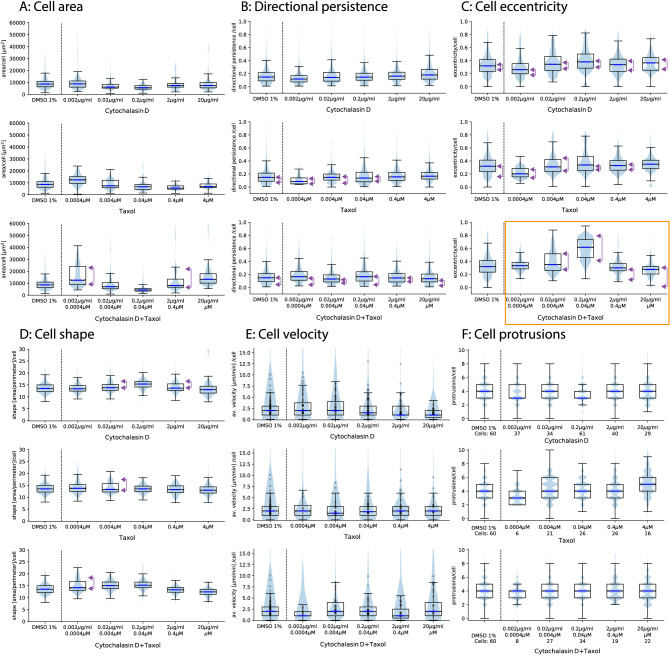
Figure 13.
Cell property distribution per cell and per frame for six cell properties. For each cell property, we present the corresponding distribution for all cells within the FOV for the control samples, cytochalasin D (top) as well as taxol (middle) and cytochalasin D combined with taxol (bottom). The black dots within figure D represent the individual average velocity for each cell with in the corresponding FOV. The horizontal blue lines correspond to the mean velocity of each sample. The purple arrows indicate the abundance of polarization.

