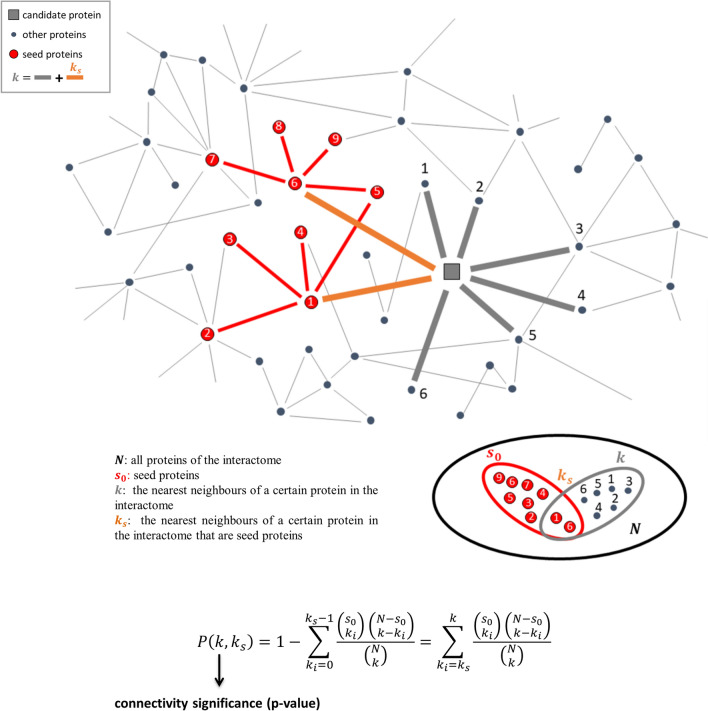
Figure 1.
DIAMOnD methodology. The network corresponds to the human interactome where the orange circular nodes are the seed proteins, the green square node is the protein to test with k connections (red and grey thick links) including ks links to seed proteins (red thick links), the grey circular nodes refer to other proteins in the interactome. The ensembles considered in the hypergeometric test for the computation of connectivity significance are reported.

