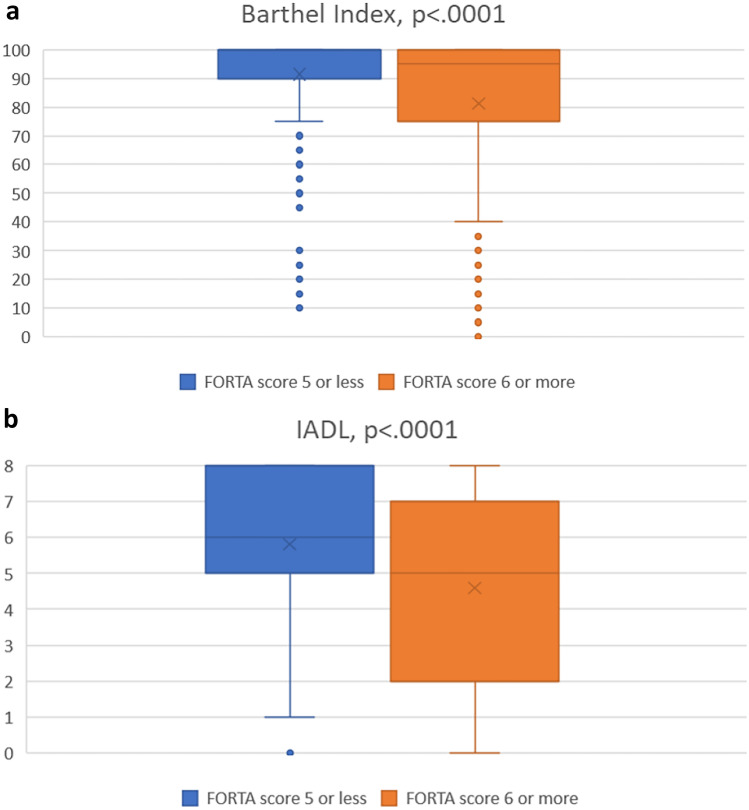
Fig. 1.
a, b Box plot of assessment of activities of daily living (Barthel Index) in a and instrumental activities of daily living (IADL) according to Lawton and Brody in b for the group with low vs. high Fit fOR The Aged (FORTA) scores at follow-up 6; the cutoff at 6 (= median) was chosen to provide nearly equal numbers of observations in both groups. The horizontal line represents the median, the box represents interquartile range, whiskers represent 95% confidence intervals, crosses represent the mean, and the circle represents an outlier

