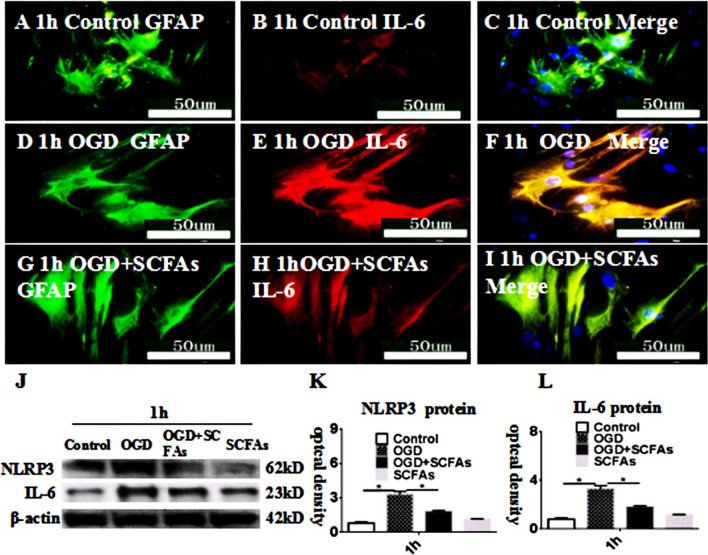
Fig. 7.
SCFAs inhibited the expression of IL-6 and NLRP3 in astrocytes after OGD in vitro. Immunofluorescence images show the expression of GFAP (A, D, G, green), IL-6 (B, E, H, red). The co-localized expression of GFAP and IL-6 can be seen in panels C, F, I. Panel J shows NLRP3 (62 kDa), IL-6 (23 kDa), and â-actin (42 kDa) immunoreactive bands. Bar graphs in K and L show significant increases in the optical density of NLRP3 and IL-6 at 1 h after OGD administration when compared with the corresponding controls. The SCFAs antagonist may attenuate the increment

