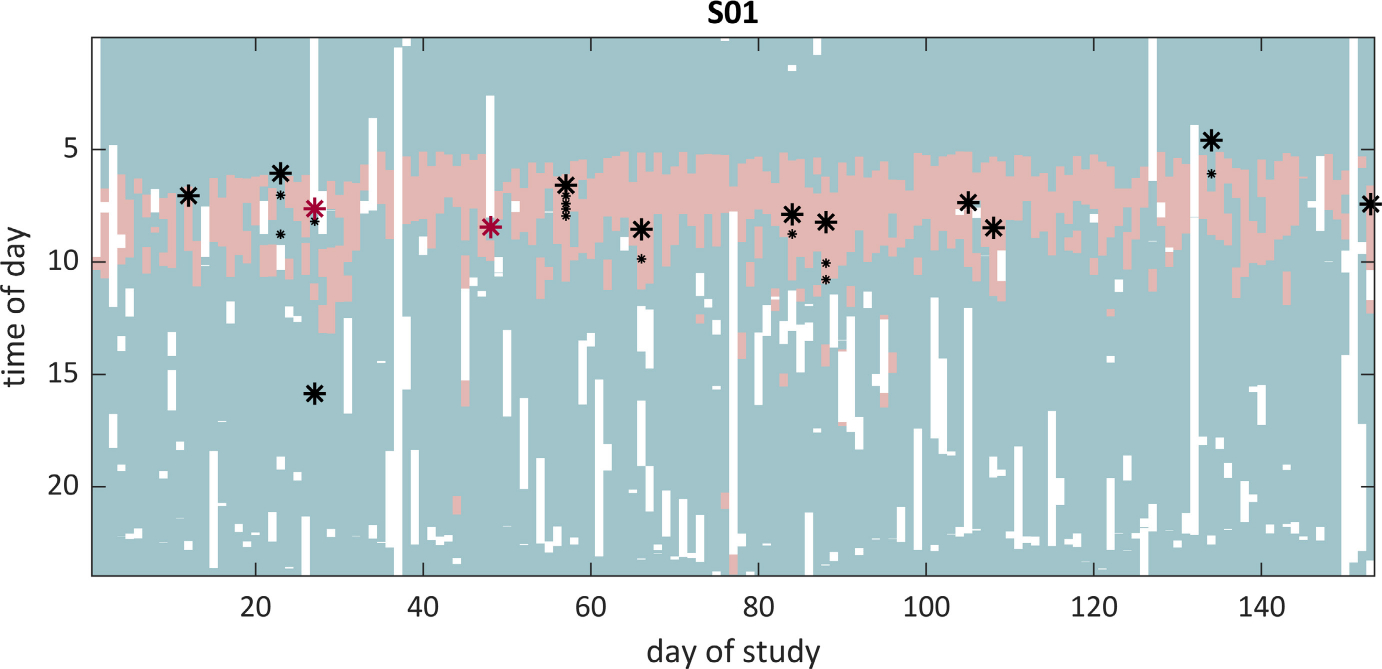
FIGURE 1.

Example of a successful seizure forecast (Subject S01, Architecture 3, bidirectional long short-term memory). Only the testing dataset is depicted (corresponding to two thirds of the full recording). Lead seizures are represented as large asterisks, and clustered seizures as small asterisks. Light red areas depict times of predicted high seizure risk, whereas light green show periods of low seizure risk. White areas show periods when the patient was not recording. Note that two seizures did not have sufficient preictal data (red asterisks) and were removed from the final performance analysis. Also note the high circadian periodicity of the forecast, matching the patient’s preferential seizure times of day. It is also noteworthy that several predicted preictal periods were not followed by a seizure, contributing to increased time in warning
