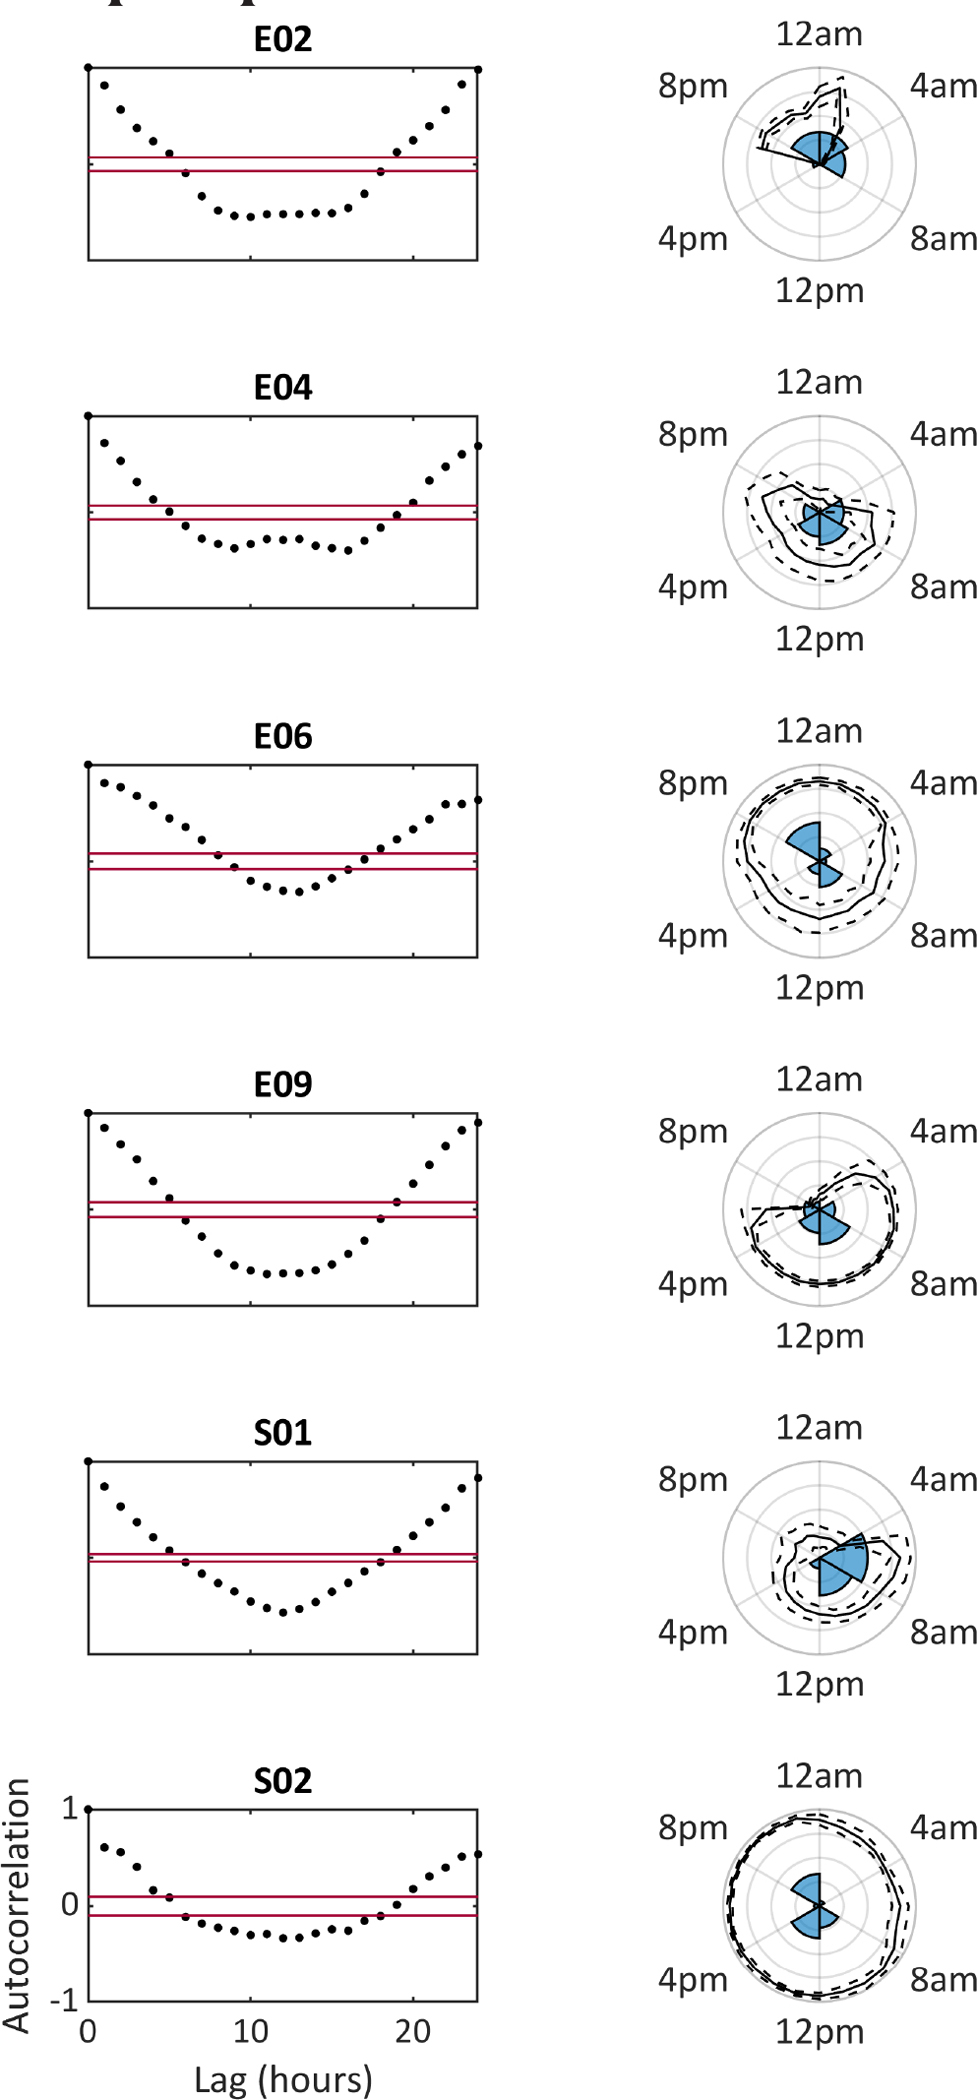
FIGURE 3.

Circadian distribution of seizures and of forecasts (for Architecture 3, bidirectional long short-term memory). Left side shows the results of the autocorrelation function of average hourly forecasts for each subject (red lines delineate 95% confidence interval bounds). Right side polar plots show the time-of-day distribution of seizures (as a percentage histogram) overlaid with the mean (solid lines) and standard deviation (dashed lines) of the forecast output at each time of day. Note the clear 24-h periodicity of the forecast for all subjects, and the overall good correspondence between seizures’ time of day and seizure risk as determined by the forecast
