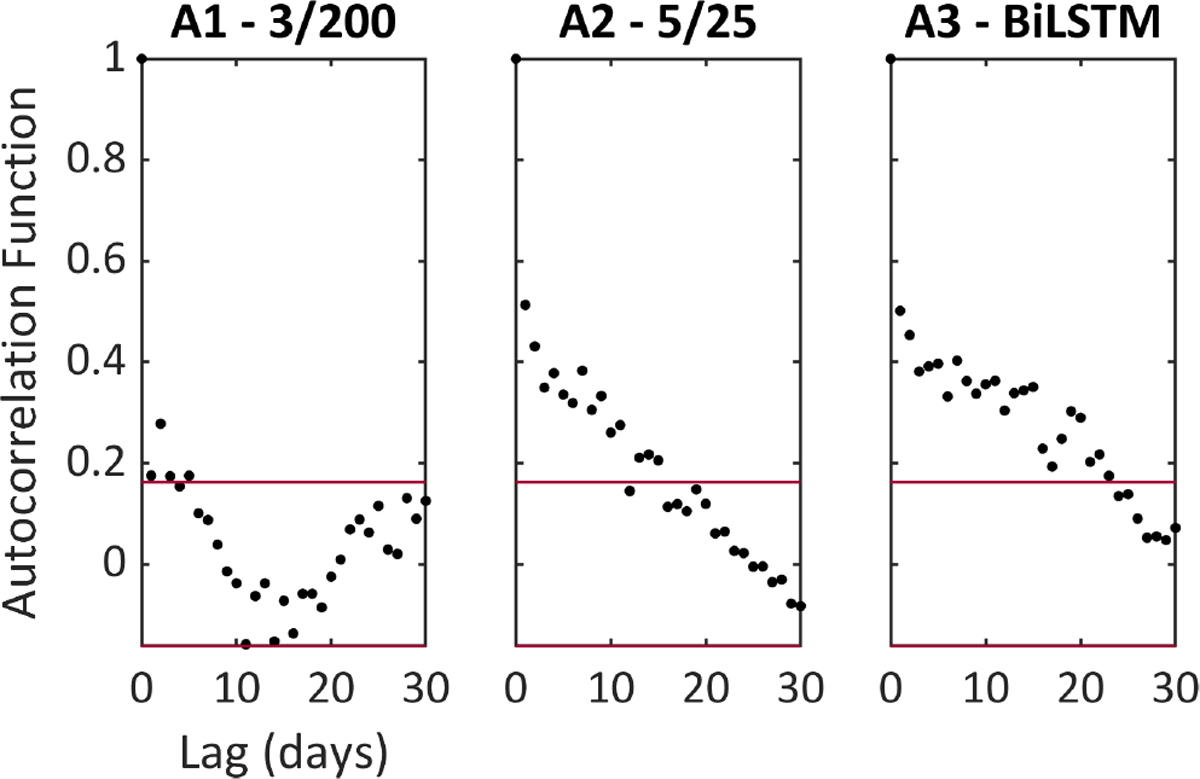
FIGURE 4.

Long-term autocorrelation of seizure forecasts for subject S01, who recorded for 230 days. Each panel shows the results of the autocorrelation function of mean daily outputs of each forecasting architecture (Architectures 1–3, respectively). Red lines indicate 95% confidence interval bounds
