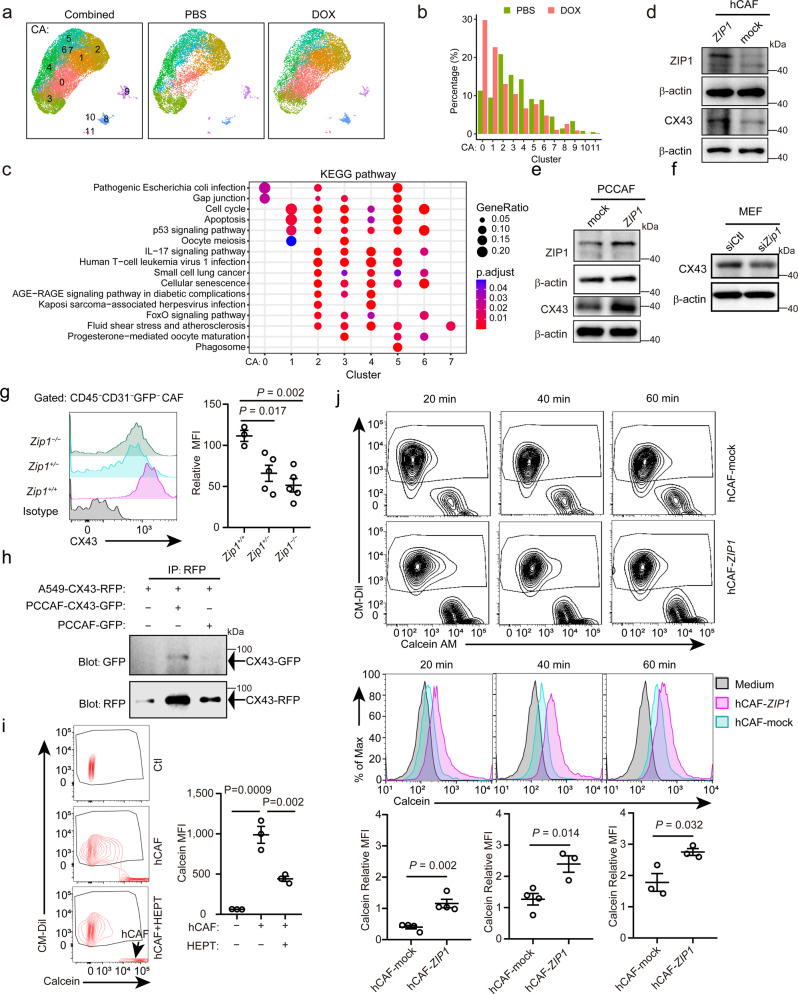
Fig. 2. ZIP1+ fibroblasts interconnect cancer cells with gap junctions by upregulating CX43.
a UMAP plot showing 12 cell subsets in PBS group, DOX group and their combined. b Bar plots showing the percentages of cells in each subset with PBS and DOX treatment. c Gene-set variation analysis of KEGG signalling pathway terms within the 8 fibroblast subsets (CA0–7). d, e ZIP1 and CX43 expression in d human lung adenocarcinoma-associated fibroblast (hCAF) and e prostate-cancer cancer-associated fibroblast (PCCAF) transfected with control (mock) or ZIP1-overexpression vector (ZIP1). Representative results from four (d), three (e, ZIP1) or five (e, CX43) independent experiments are shown. f CX43 expression in mouse embryonic fibroblasts (MEFs) transfected with control (siCtl) or Zip1-silencing (siZip1) siRNA. A representative result from five independent experiments is shown. β-actin was used as control. The samples derived from the same experiment and blots were processed in parallel (e-f). g CX43 expression on the cell surface of Zip1+/+, Zip1+/− and Zip1−/− CAFs. Single-cell suspensions of LLC-GFP-luc tumours from indicated mice were analysed by FACS on day 22. CD45−CD31−GFP− CAFs were gated. Relative mean fluorescence intensity (MFI) was calculated as MFI[sample]/MFI[negative control]−1. Data are presented as mean ± SEM, n = 3 for Zip1+/+, n = 5 for Zip1+/− and Zip1−/−. Two-tailed t test. h Direct CX43-CX43 interaction between A549 and PCCAF. A549-CX43-RFP and PCCAF-CX43-GFP were constructed and cocultured. Co-immunoprecipitation (IP) of CX43-RFP and CX43-GFP was examined by western blotting. A representative result from two independent experiments is shown. (i) Calcein transfer from hCAFs to A549 tumour cells. A549 cells (pre-labelled with CM-Dil) and hCAFs (loaded with 0.5 μM calcein-AM) were co-cultured for 2 h in DMEM + 10% FBS. Heptanol (HEPT, 2 mM) was used to block gap junctions. Calcein fluorescence in tumour cells was determined by FACS. Arrow, the position of hCAFs. Mean ± SEM, n = 3 for each group. Two-tailed t test. j Calcein transfer from hCAF-mock/hCAF-ZIP1 to A549 tumour cells at the indicated time. A549 alone without fibroblasts were used as a control. Calcein relative MFI in A549 cells of different groups was compared. Mean ± SEM, n = 4 for hCAF-mock 20, 40 min and hCAF-ZIP1 20 min, n = 3 for hCAF-mock 60 min and hCAF-ZIP1 40, 60 min. Two-tailed t-test. Source data are provided as a Source Data file (b, d–j).

