Figure 3.
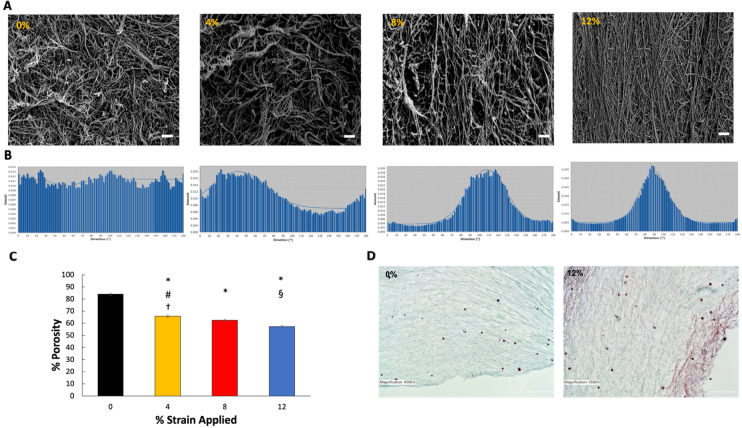
Effects of mechanical strain on fibrous protein remodeling and porosity within 3D tissue analogues. (A) SEM images of 0%, 4%, 8% and 12% mechanical strain 3D tissue analogues, scale bar represents 20 μm. (B) Directionality histograms of 3D tissue analogues subjected to 7 days of uniaxial loading, (C) %porosity graph, (D) H&E histological images of 0% and 12% mechanical strain 3D tissue analogues, scale bar represents 100 μm (n = 3). *Indicates significant difference with respect to 0% mechanical strain group (control). #Represents a significant difference between 4 and 8% mechanical strain groups, §represents a significant difference between 8 and 12% strain groups, and †represents a significant difference between 4 and 12% strain groups, each with p < 0.05.

