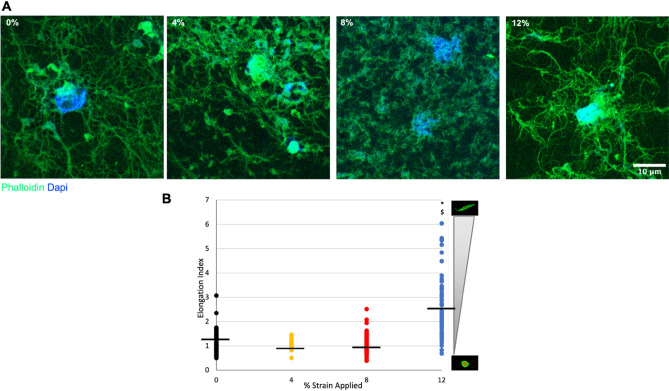
Figure 4.
Cell elongation index (EI) analysis for HFF1 cells within the 3D tissue analogues after uniaxial loading. The gradient scale to the right designates the spectrum of cell measurements, with corresponding representative images of cell morphologies. *Indicates significant difference with respect to 0% mechanical strain group (control). #Represents a significant difference between 4 and 8% mechanical strain groups, §represents a significant difference between 8 and 12% strain groups, and †represents a significant difference between 4 and 12% strain groups, each with P < 0.05.

