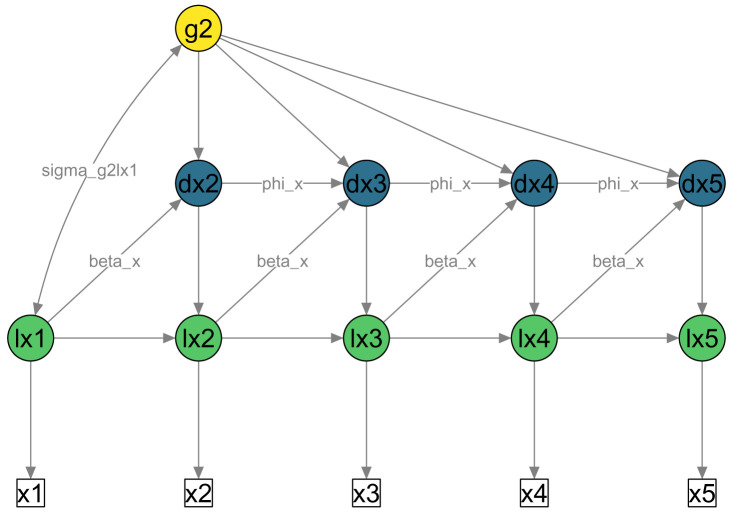
Figure 1. Simplified path diagram of univariate LCSM.
White squares = Observed scores on variable ’x’ across timepoints 1 to 5; Green circles = Latent true scores (prefix ‘l’); Blue circles = Latent change scores (prefix ‘d’); Yellow circle = Constant latent change factor. Single-headed arrows = Regressions; Double-headed arrows = Covariance. beta_x = Proportional change factor; phi_x = Autoregression of change scores; sigma_g2lx1 = Covariance of change factor ( g2) with initial true score ( lx1). Unique scores ( ux t ) and unique variances ( ) are not shown in this figure for simplicity.

