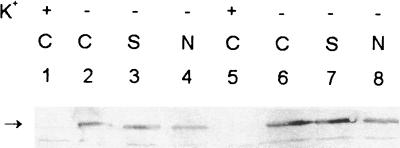
FIG. 3.
Effect of osmotic and salinity stresses on KdpB levels in E. coli strain MC4100. Cells were grown either in K115 (lanes 1 and 5) or in BG-11/K0 (lanes 2 and 6) medium. Part of the cells grown in BG-11/K0 medium were stressed with either 0.4 M sucrose (lanes 3 and 7) or 0.25 M NaCl (lanes 4 and 8). Samples were collected at 6 (lanes 1 to 4) or 24 (lanes 5 to 8) h after the initiation of K+ deprivation. Other details were as given for Fig. 2B.

