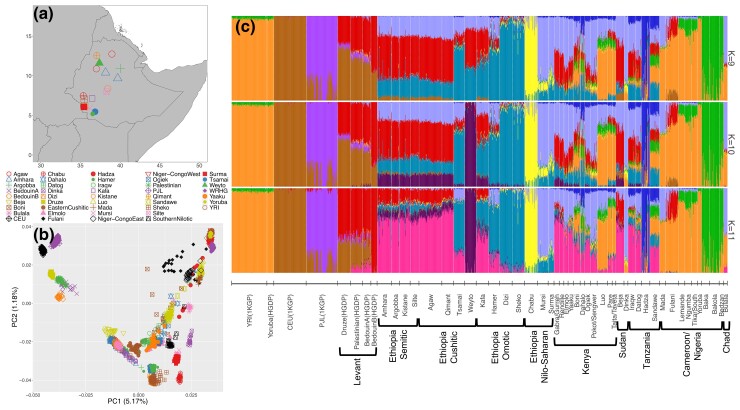
Fig. 1.
(a) Sampling locations of Ethiopian samples examined in this study for genome-wide patterns of positive selection. (b) Principal component analysis (PCA) of Ethiopian populations in combination with African and non-African populations. Ethiopian Afroasiatic Cushitic- and Semitic-speaking populations generally cluster together, while Omotic speakers form their own cluster. Nilo-Saharan speakers are distinct from other Ethiopians. (c) ADMIXTURE analysis of Ethiopians in combination with African and non-African populations. Results for K = 9 through 11 are shown. K = 11 had the smallest cross-validation error of all K-values. Language family is denoted below the plot for all Ethiopian populations. YRI, Yoruba from one thousand genomes (1KGP), CEU, Northern and Western European (1KGP), PJL, Punjabi (1KGP). For plotting purposes, some groupings contain multiple ethnicities.

