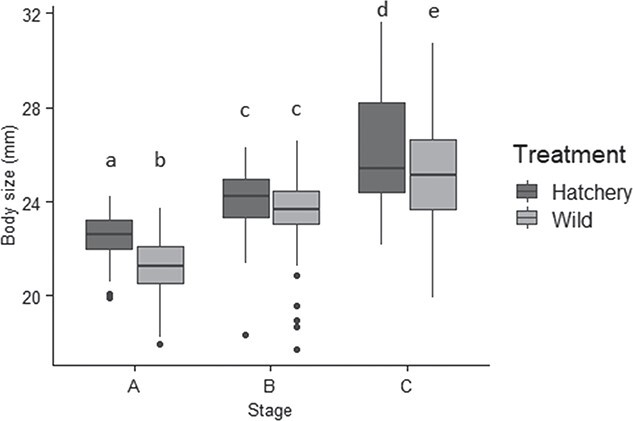
Figure 1.

Body size (data on original scale, prior to log-transformation) across all three stages for both treatments: stage A (day one of the larval stage for hatchery-produced larvae, or the day after capture for wild-caught larvae), stage B (day five of the larval stage), and stage C (day nine of the larval stage) (n = 216 individuals per stage, or 648 individuals total). Size increased significantly across stages (p < 0.0001). Tukey HSD indicated that hatchery larvae were significantly larger than wild larvae at stages A and C, but not at stage B. Whiskers indicate minimum and maximum values, excluding data points (represented by dots) beyond 1.5 x the interquartile range for the upper and lower quartiles. Letters indicate results of Tukey HSD test.
