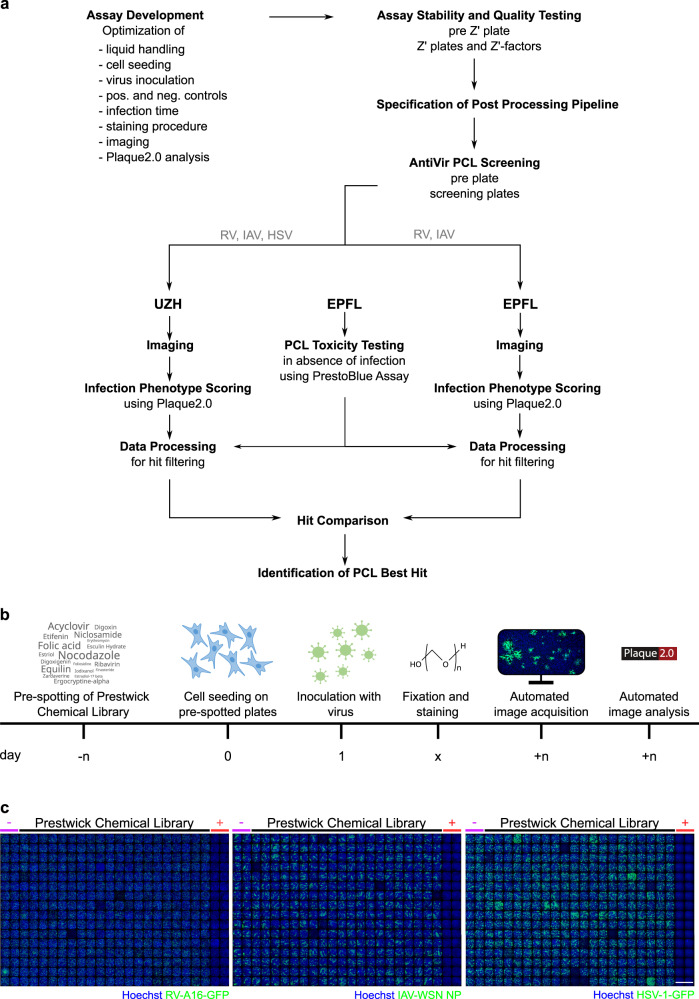
Fig. 1.
Screening pipeline. (a) Prior to screen execution, several assay parameters were optimized. Stability and quality were verified with pre-plates and Z’-plates. The subsequent screening was followed by image acquisition and analysis at two independent institutions UZH and EPFL. Identified hits were compared and best hits were selected. (b) Timeline for the wet-lab pipeline. A549 or HOG cells were seeded on 384-well plates pre-spotted with PCL compounds and control compounds through an Echo acoustic liquid handling system, yielding a final concentration of 1.25 μM upon cell seeding in 80 μl. On the next day, the adherent cells were inoculated with virus, PFA-fixed after 48 h for RV, 34 h for IAV, and 26 h for HSV-1, and stained with Hoechst 33342 and antibody, if necessary. Plates were then imaged using a high-throughput epifluorescence microscope, and analyzed with the Plaque2.0 software. (c) Exemplary overviews of one screening plate for each virus screen. Individual images of each well were stitched yielding the overviews. First two columns of each plate contained DMSO control solvent, the following 20 columns PCL compounds, and the last two columns the positive controls (BafA1 for RV and IAV, and GCV for HSV-1). Scale bar represents 10 mm.

