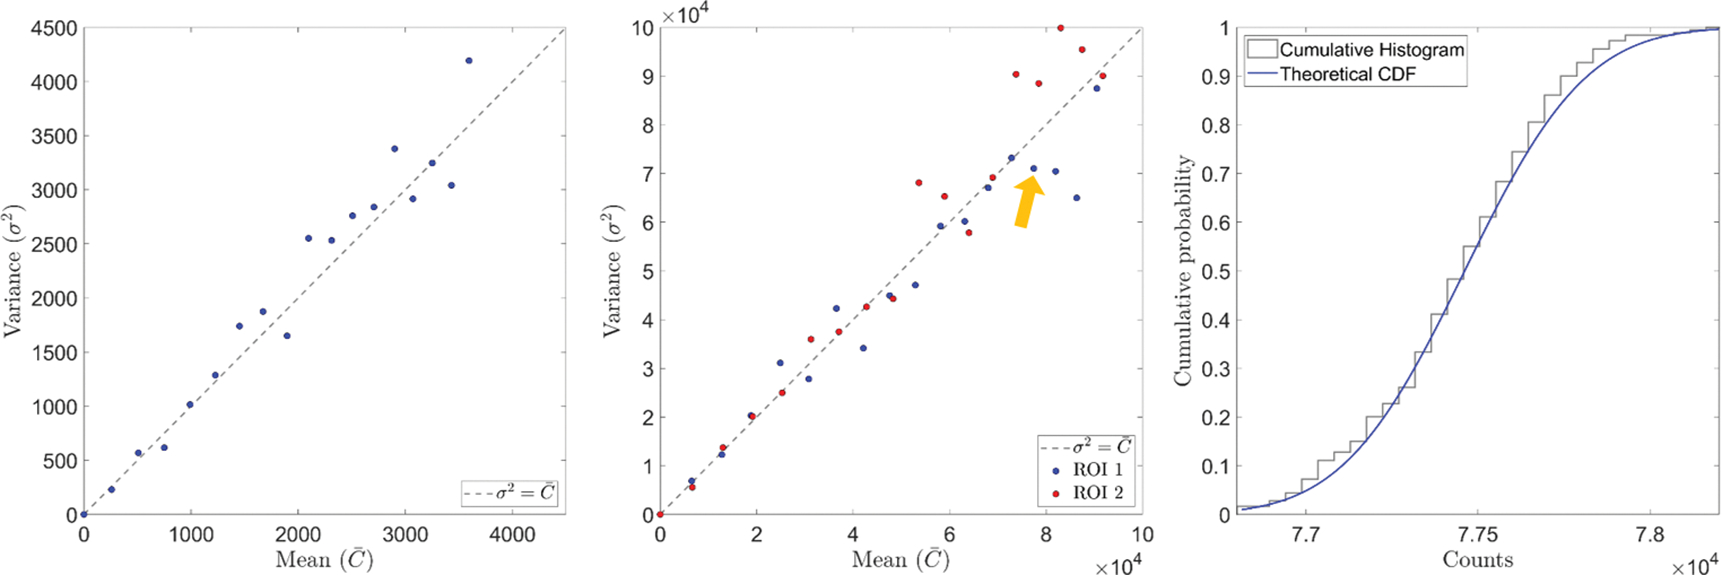
Figure 5:

Comparison of mean and variance of photon counts in a randomly selected pixel (left) and two ROIs (middle). Right: cumulative histogram and theoretical cumulative distribution function of Poisson distribution of a selected point indicated by the yellow arrow in the middle figure.
