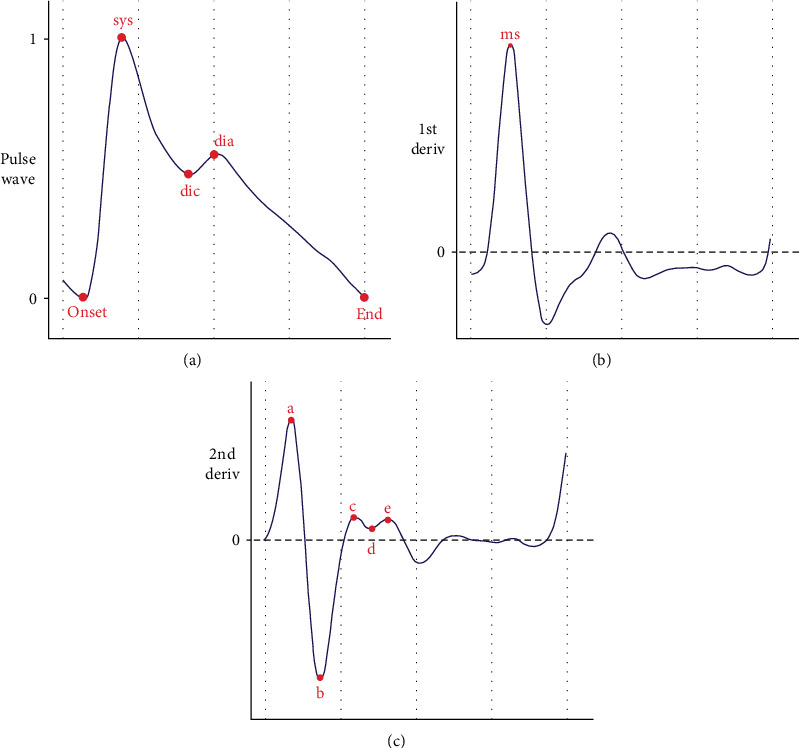
Figure 2.

Fiducial points of PPG wave and its derivatives: The three subplots from top to bottom are (a) PPG pulse wave, (b) first-order derivative, and (c) second-order derivative. In (a), “onset” and “end” denote the beginning and the end of the waveform, respectively, “sys” and “dia” represent the systolic and diastolic peaks, and “dic” represents the dicrotic notch. In (b), “ms” denotes the maximum slope point. In (c), “a,” “b,” “c,” “d,” and “e” are five key fiducial points of the second derivative.
