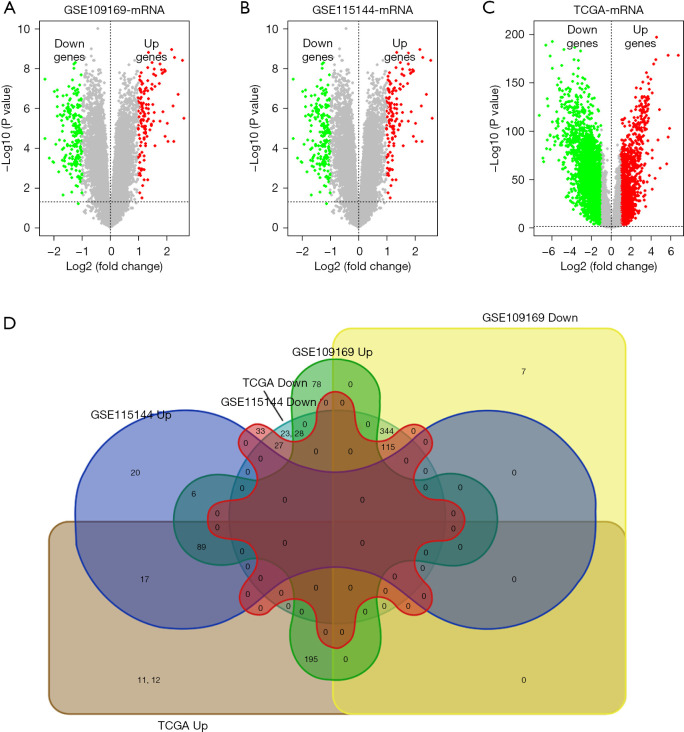
Figure 1.
Convergence of gene expression signatures across different studies of breast cancer. (A-C) Volcano plots showed the number of DEGs identified from GSE109169, GSE115144, and TCGA of breast cancer. (D) Intersecting DEGs from GSE109169, GSE115144, and TCGA are showed by Venn diagram. TCGA, The Cancer Genome Atlas; DEGs, differentially expressed genes.

