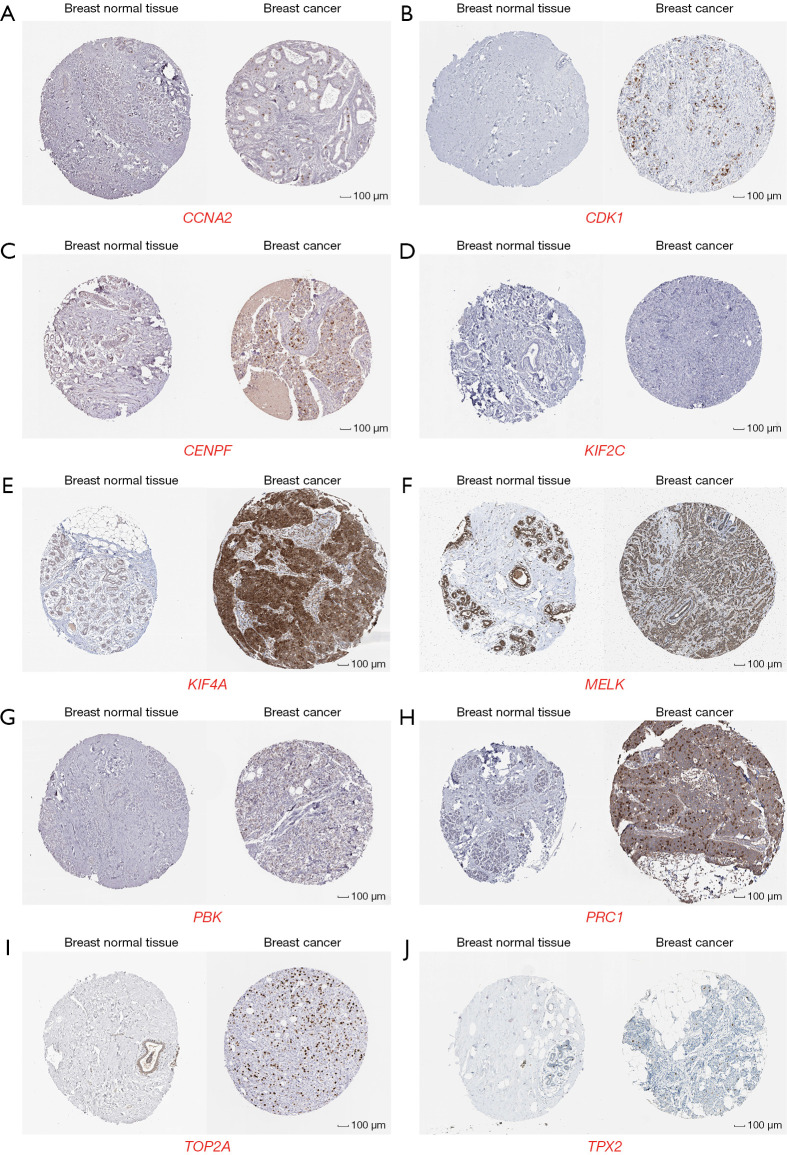
Figure 6.
Expression profiles of the 10 hub genes in human cancer and normal tissues. Representative immunohistochemical images of (A) CCNA2 (https://www.proteinatlas.org/ENSG00000145386-CCNA2/tissue/breast) and (https://www.proteinatlas.org/ENSG00000145386-CCNA2/pathology/breast+cancer#img), (B) CDK1 (https://www.proteinatlas.org/ENSG00000170312-CDK1/tissue/breast) and (https://www.proteinatlas.org/ENSG00000170312-CDK1/pathology/breast+cancer#img), (C) CENPF (https://www.proteinatlas.org/ENSG00000117724-CENPF/tissue/breast) and (https://www.proteinatlas.org/ENSG00000117724-CENPF/pathology/breast+cancer#img), (D) KIF2C (https://www.proteinatlas.org/ENSG00000142945-KIF2C/tissue/breast) and (https://www.proteinatlas.org/ENSG00000142945-KIF2C/pathology/breast+cancer#img), (E) KIF4A (https://www.proteinatlas.org/ENSG00000090889-KIF4A/tissue/breast) and (https://www.proteinatlas.org/ENSG00000090889-KIF4A/pathology/breast+cancer#img), (F) MELK (https://www.proteinatlas.org/ENSG00000165304-MELK/tissue/breast) and (https://www.proteinatlas.org/ENSG00000165304-MELK/pathology/breast+cancer#img), (G) PBK (https://www.proteinatlas.org/ENSG00000168078-PBK/tissue/breast) and (https://www.proteinatlas.org/ENSG00000168078-PBK/pathology/breast+cancer#img), (H) PRC1 (https://www.proteinatlas.org/ENSG00000198901-PRC1/tissue/breast) and (https://www.proteinatlas.org/ENSG00000198901-PRC1/pathology/breast+cancer#img), (I) TOP2A (https://www.proteinatlas.org/ENSG00000131747-TOP2A/tissue/breast) and (https://www.proteinatlas.org/ENSG00000131747-TOP2A/pathology/breast+cancer#img), and (J) TPX2 (https://www.proteinatlas.org/ENSG00000088325-TPX2/tissue/breast) and (https://www.proteinatlas.org/ENSG00000088325-TPX2/pathology/breast+cancer#img) protein expression in normal breast and cancer tissues. (A-J) are from the HPA (images are available from v21.1 proteinatlas.org). Counterstained with hematoxylin, 100 µm.

