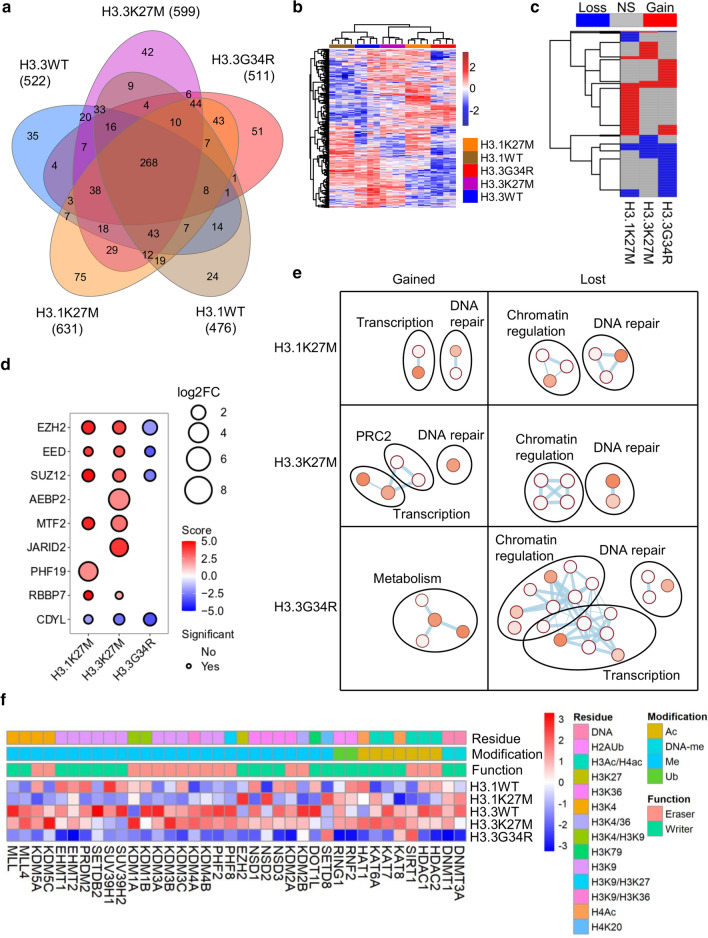
Fig. 1.
BioID interactome of wild-type and mutant H3. A Summary of high-confidence interactors detected with each histone. B Heatmap of all peptide counts of all high-confidence interactors identified in the experiment. C Heatmap depicting proteins differentially bound by any oncohistone relative to its WT control. D Bubble plot showing differential enrichment of PRC2 components with each oncohistone relative to its WT control. Size = log2(mutant/WT). Color represents significance. Statistically significant (p < 0.05) differential interactions have a black border. E Network of Reactome and KEGG pathways significantly enriched (p < 0.05) among differentially bound proteins by each oncohistone. Node size and color reflects significance and edge thickness reflects number of proteins shared between two nodes. F Heatmap of relative peptide counts of proteins with direct histone modifying activity identified by BioID. Average peptides per histone were Z-transformed

