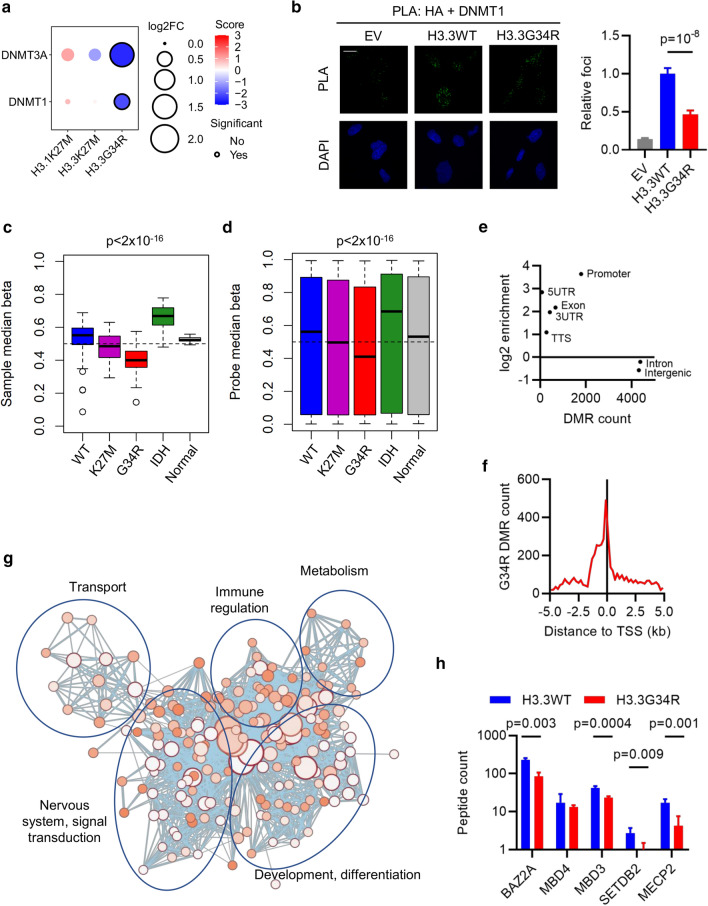
Fig. 3.
Reduced interaction with DNA methyltransferases leads to global hypomethylation in H3.3G34R-mutant pHGG. A Bubble plot showing differential enrichment of DNMT1 and DNMT3A with each oncohistone relative to WT control. Size = log2(mutant/WT). Color is a function of -log10 p-value and direction of interaction change. Statistically significant (p < 0.05) differential interactions have a black border. B Proximity ligation assays in MO3.13 cells between HA-H3 and DNMT1. Scale bar: 20 μm. Results are representative of two biological replicates and show mean foci counts relative to H3.3WT ± standard error. n: EV = 52; H3.3WT = 73; H3.3G34R = 61. p: ANOVA. C Median methylation beta value per sample from pHGG categorized as WT (n = 98); mutant for K27M (n = 34), G34R (n = 24), or IDH (n = 25); or normal brain (n = 7). The box marks the interquartile range (IQR) and shows the median value. The whiskers extend to 1.5 × IQR. p: ANOVA. D Median methylation beta value per probe from pHGG categorized as WT (n = 98); mutant for K27M (n = 34), G34R (n = 24), or IDH (n = 25); or normal brain (n = 7). The box marks the interquartile range (IQR) and shows the median value. The whiskers extend to 1.5 × IQR. p: ANOVA. E Scatter plot of number of differentially methylated regions (DMR) detected in H3.3G34R-mutant (n = 24) vs WT (n = 98) tumors assigned to each genomic location category versus the log2-enrichment against an expected background. F Enrichment of DMRs detected in H3.3G34R-mutant (n = 24) vs WT (n = 98) tumors around transcription start sites (TSS). G Network of pathways (Reactome, KEGG, Gene Ontology Biological Processes) enriched in genes with DMRs ± 1 kb from the TSS. Node size and color reflects significance and edge thickness reflects number of genes shared between two nodes. H Peptide counts of methyl-binding domain (MBD) containing proteins identified by BioID with H3.3WT or H3.3G34R. p: t test

