Fig. 5.
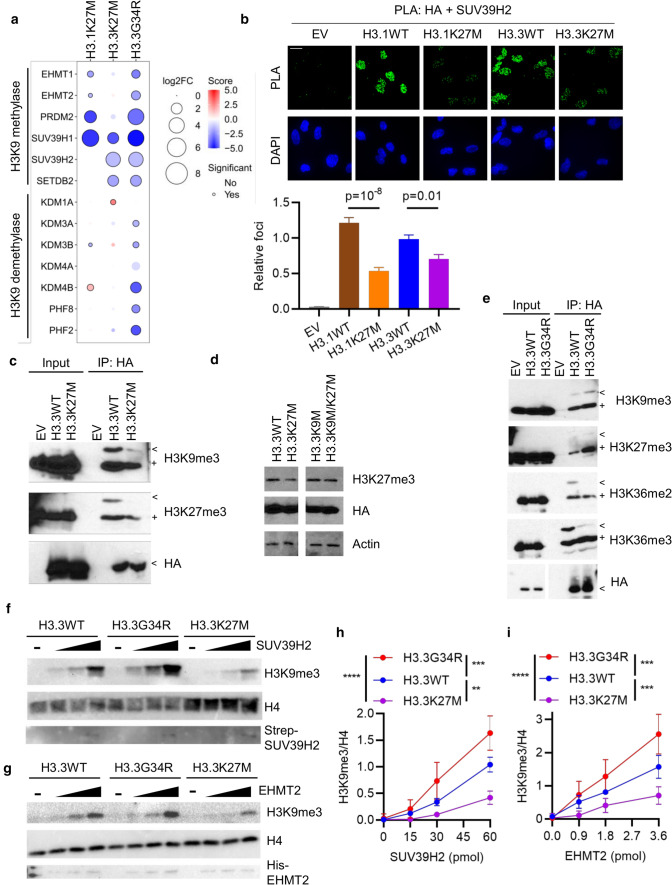
Oncohistones disrupt H3K9 methylation. A Bubble plot showing differential enrichment of indicated H3K9 methylases and demethylases with each oncohistone relative to WT control. Size = log2(mutant/WT). Color represents significance. Statistically significant (p < 0.05) differential interactions have a black border. B Proximity ligation assays in MO3.13 cells between HA-H3 and SUV39H2. Scale bar: 20 μm. Results are representative of two biological replicates and show mean foci counts relative to H3.3WT ± standard error. n: EV = 14; H3.1WT = 36; H3.1K27M = 67; H3.3WT = 60; H3.3K27M = 62. p: ANOVA. C Ectopic histone-containing nucleosomes were immunoprecipitated (IP) from H3-expressing NHA cells and ectopic and endogenous modifications were assessed by western blotting. < : Ectopic HA-tagged histone. + : endogenous histone. D NHA cells were transduced with indicated constructs and whole cell lysates analyzed by western blotting. E Ectopic histone-containing nucleosomes were immunoprecipitated (IP) from H3-expressing NHA cells and ectopic and endogenous modifications were assessed by western blotting. < : Ectopic HA-tagged histone. + : endogenous histone. F Representative gels from in vitro methylation assays carried out with nucleosomes assembled with H3.3WT, H3.3G34R or H3.3K27M and incubated with increasing amounts of SUV39H2. G Representative gels from in vitro methylation assays carried out with nucleosomes assembled with H3.3WT, H3.3G34R or H3.3K27M and incubated with increasing amounts of EHMT2. H Quantification of SUV39H2 methylation assays from F (n = 3). p (ANOVA): H3.3WT vs H3.3K27M, p = 0.003; H3.3WT vs H3.3G34R, p = 0.001; H3.3K27M vs H3.3G34R, p = 10–7. I Quantification of EHMT2 methylation assays from G (n = 3). p (ANOVA): H3.3WT vs H3.3K27M, p = 0.006; H3.3WT vs H3.3G34R, p = 0.009; H3.3K27M vs H3.3G34R, p = 10–6

