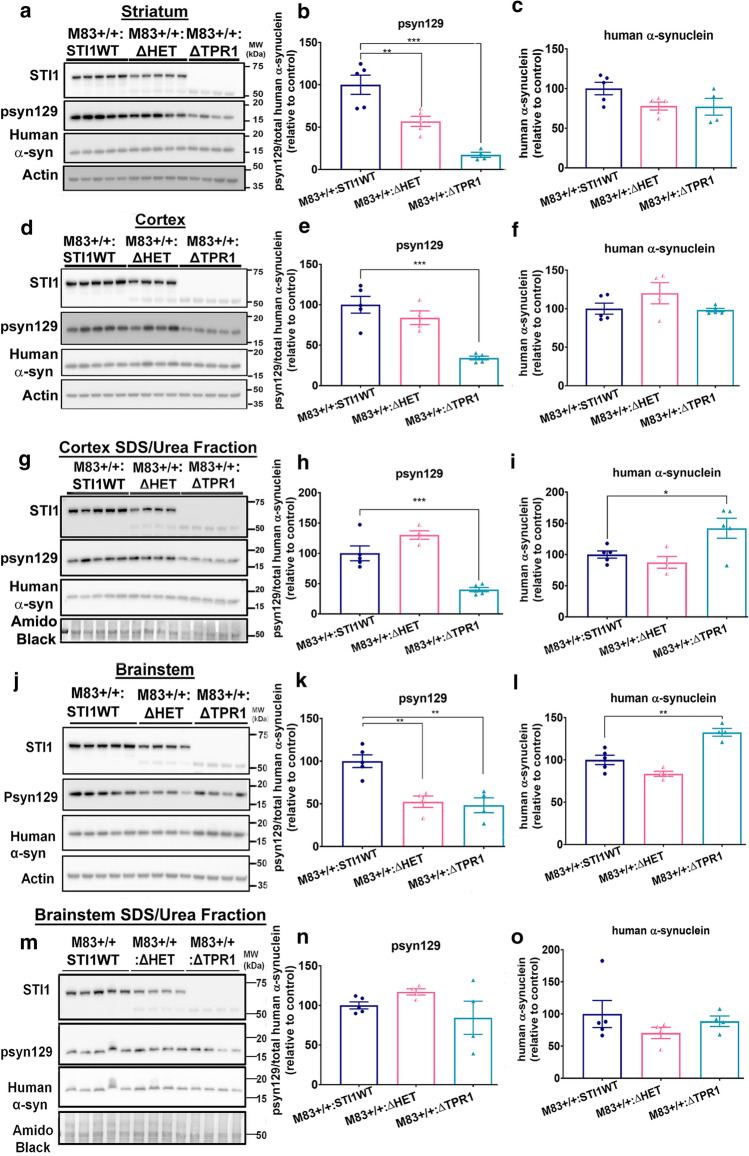
Fig. 5.
Reduced psyn129 in M83+/+ mice carrying STI1 hypomorphic alleles. a Immunoblot from RIPA extracted striatal lysates from M83+/+:ΔTPR1 mice. b Densitometric quantification of psyn129 (ab51253) antibody, relative to total human α-synuclein (genotype: F(2,11) = 2484, p < 0.0001, adjusted for multiple comparisons with Dunnett’s multiple comparisons: M83+/+:STI1WT vs. M83+/+:ΔHET p = 0.005, M83+/+:STI1WT vs. M83+/+:ΔTPR1 p < 0.0001) c Human α-synuclein relative to actin loading control (genotype: F(2,11) = 2.887, p = 0.098). d Immunoblot from RIPA cortical lysates and e. Densitometric quantifications of psyn129 (ab51253) relative to total human α-synuclein (genotype: F(2,11) = 20.57, p = 0.0002, adjusted for multiple comparisons with Dunnett’s multiple comparisons test: M83+/+:STI1WT vs. M83+/+:ΔHET p = 0.305, M83+/+:STI1WT vs. M83+/+:ΔTPR1 p = 0.0001) f Densitometric quantification of human α-synuclein relative to actin loading control (genotype: F(2,11) = 2.048, p = 0.175). g Representative immunoblot for STI1, psyn129, and human α-synuclein in M83+/+ :ΔTPR1 mice in SDS/Urea-soluble cortical fraction (RIPA-insoluble fraction). h Densitometric quantification of psyn129 (relative to human α-synuclein; genotype, F(2,11) = 106, p = 0.0009, adjusted for multiple comparisons with Dunnett’s multiple comparisons: M83+/+:STI1WT vs. M83+/+:ΔHET p = 0.619, M83+/+:STI1WT vs. M83+/+:ΔTPR1 p = 0.0008). i Densitometric quantification of human α-synuclein (relative to amido black) (genotype, F(2,11) = 19.49, p = 0.0002, Dunnett’s multiple comparisons: M83+/+:STI1WT vs. M83+/+:ΔHET p = 0.868, M83+/+:STI1WT vs. M83+/+:ΔTPR1 p = 0.0003). j Immunoblot for RIPA brainstem lysates and k Densitometric quantifications of psyn129 (ab51253) relative to total human α-synuclein (genotype F(2,10) = 14.93, p = 0.001, Dunnett’s multiple comparisons test: M83+/+:STI1WT vs. M83+/+:ΔHET p = 0.0024, M83+/+:STI1WT vs. M83+/+:ΔTPR1 p = 0.0013). l Densitometric quantifications of human α-synuclein relative to actin loading control (genotype F(2,10) = 25.60, p = 0.0001, Adjusted for multiple comparisons with Dunnett’s multiple comparisons test: M83+/+:STI1WT vs. M83+/+:ΔHET p = 0.0594, M83+/+:STI1WT vs. M83+/+:ΔTPR1 p = 0.0012). m Immunoblots from SDS/Urea-soluble brainstem tissue lysates. n densitometric quantification psyn129 (relative to human α-synuclein) (genotype, F(2,10) = 1.827, p = 0.217). o. Densitometric quantification of human α-synuclein (relative to amido black) (genotype (F(2,10) = 0.9151, p = 0.4316). N = 4–5 mice per genotype. Individual dark blue circles (M83+/+:STI1WT), half-filled pink triangles (M83+/+:ΔHET), or filled turquoise triangles (M83+/+:ΔTPR1) represent individual animals. White open circle represents M83 non-transgenic mice (WT mice). Immunoblotting data presented as mean ± SEM and analyzed using one-way ANOVA with appropriate post hoc comparisons, when required. *p < 0.05, **p < 0.01, ***p < 0.0001

