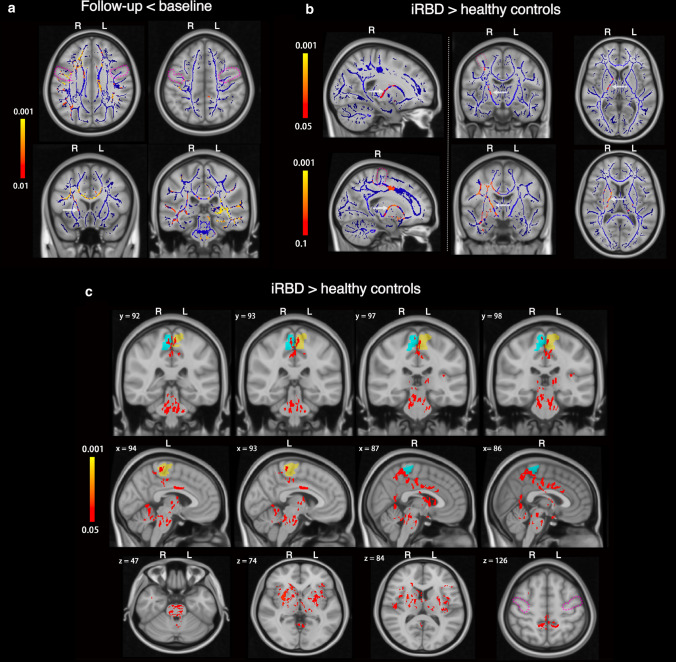
Fig. 1.
Microstructural changes in the motor system of longitudinally followed iRBD cases that progressed to silent and/or prodromal motor PD. a Longitudinal fractional anisotropy (FA) changes in the iRBD group (n = 8). Blue lines illustrate the mean skeletonized FA of WM across the two visits. White arrows point to the anatomical location of the cortico-spinal tract. Colour bars represent corrected p values (Follow-up < baseline) by threshold-free cluster enhancement with 10,000 permutations. No significant voxel was found for Follow-up > baseline. b Skeletonized FA comparison between iRBD and controls at follow-up. Blue lines illustrate the mean skeletonized FA of WM across the two groups. Colour bars represent corrected p values for iRBD > healthy controls by Threshold-Free Cluster Enhancement with 10,000 permutations. The threshold p value for comparison of the upper row was 0.05 and of the lower row was 0.1. No significant voxel was found for iRBD < healthy controls. c Whole-brain FA comparison between iRBD and controls at follow-up. Blue and yellow shadows indicate right and left paracentral lobules, respectively, which contain the primary motor cortex sampled in our post-mortem study. Colour bar represents the corrected p values for iRBD > healthy controls by Threshold-Free Cluster Enhancement with 10,000 permutations. No significant voxel was found for iRBD < healthy controls. x, y, and z are MNI (Montreal Neurological Institute) coordinates in the standard space. x ranges from 0 to 181 as from right to left. y ranges from 0 to 217 as from posterior to anterior. z ranges from 0 to 181 as from bottom to top. White arrows in a and b point to the anatomical location of the cortico-spinal tract. Abbreviations: Follow-up < baseline: iRBD group had decreased FA in the longitudinal analysis, Follow-up > baseline: iRBD group had increased FA in the longitudinal analysis, iRBD > healthy control group: iRBD group had higher FA than that of healthy control group, iRBD < healthy control group: iRBD group had lower FA than that of healthy control group

