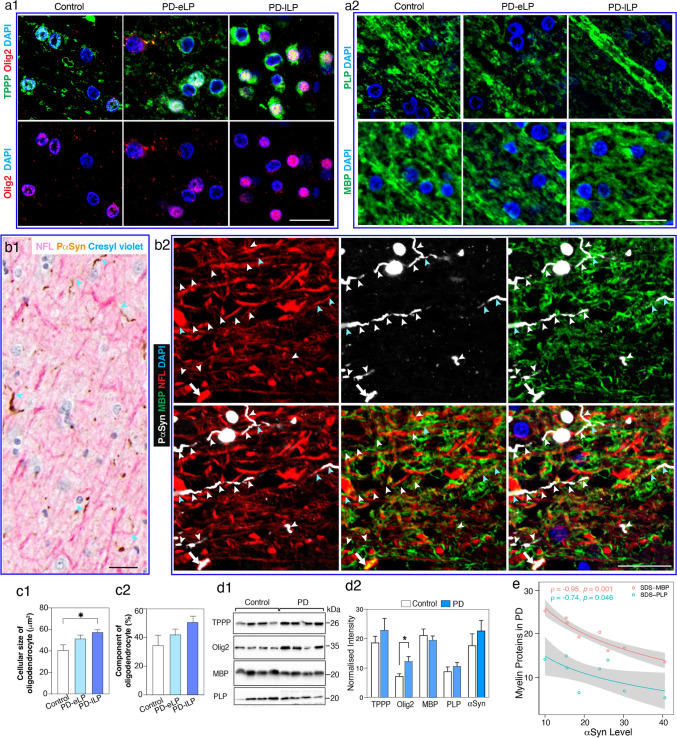
Fig. 3.
White matter oligodendrocyte, myelin and axonal pathologies underlying the motor cortex in motor PD. a Confocal immunofluorescent images from a representative control and early and late PD case (PD-eLP and PD-lLP, respectively) showing the morphology of oligodendrocytes using tubulin polymerization promoting protein (TPPP/P25α, green) and oligodendrocyte transcription factor 2 (Olig2, red) in the left panel (a1) and myelin using myelin proteolipid protein (PLP, green) and myelin basic protein (MBP, green) in the right panel (a2). Glial nuclei were revealed using DAPI (blue). Scale bars are 20 mm for all images in a and b. b1 Neurofilament L (NFL, pink)-labelled axons continuous with phospho-Ser129 aSyn (PS129, brown) labelled neurites were revealed with double labelling IHC (light blue arrowheads). b2 Immunofluorescence labelling showing the locations of axon (NFL, red), neurites (P-aSyn, white), and myelin (MBP, green). Still forming (blue arrowheads, NFL + , PaSyn + , MBP +) and mature neurites (white arrowheads, PaSyn + but NFL, MBP) as well as a larger congested segment of an axon (white arrows, NFL + , PaSyn + , MBP +) can be seen. c1 The size and c2 proportion of TPPP/P25α + oligodendrocytes in each group are shown as bar graphs (mean ± SEM, n = 8–13 per group). Statistical difference was tested with the Kruskal–Wallis followed by Dunn’s multiple comparisons. *p < 0.05. d1 Representative western immunoblots of oligodendrocyte proteins in controls (n = 12) and PD cases (n = 8). d2 Column graphs represent the mean of normalised intensity ± SEM. *Mann–Whitney test p < 0.05. e Negative Spearman rank correlations between the levels of myelin proteins (MBP and PLP) and aSyn in PD cases. Grey zones indicate 95% confidence intervals which are automatically calculated based using the predicted values for the line of best fit

