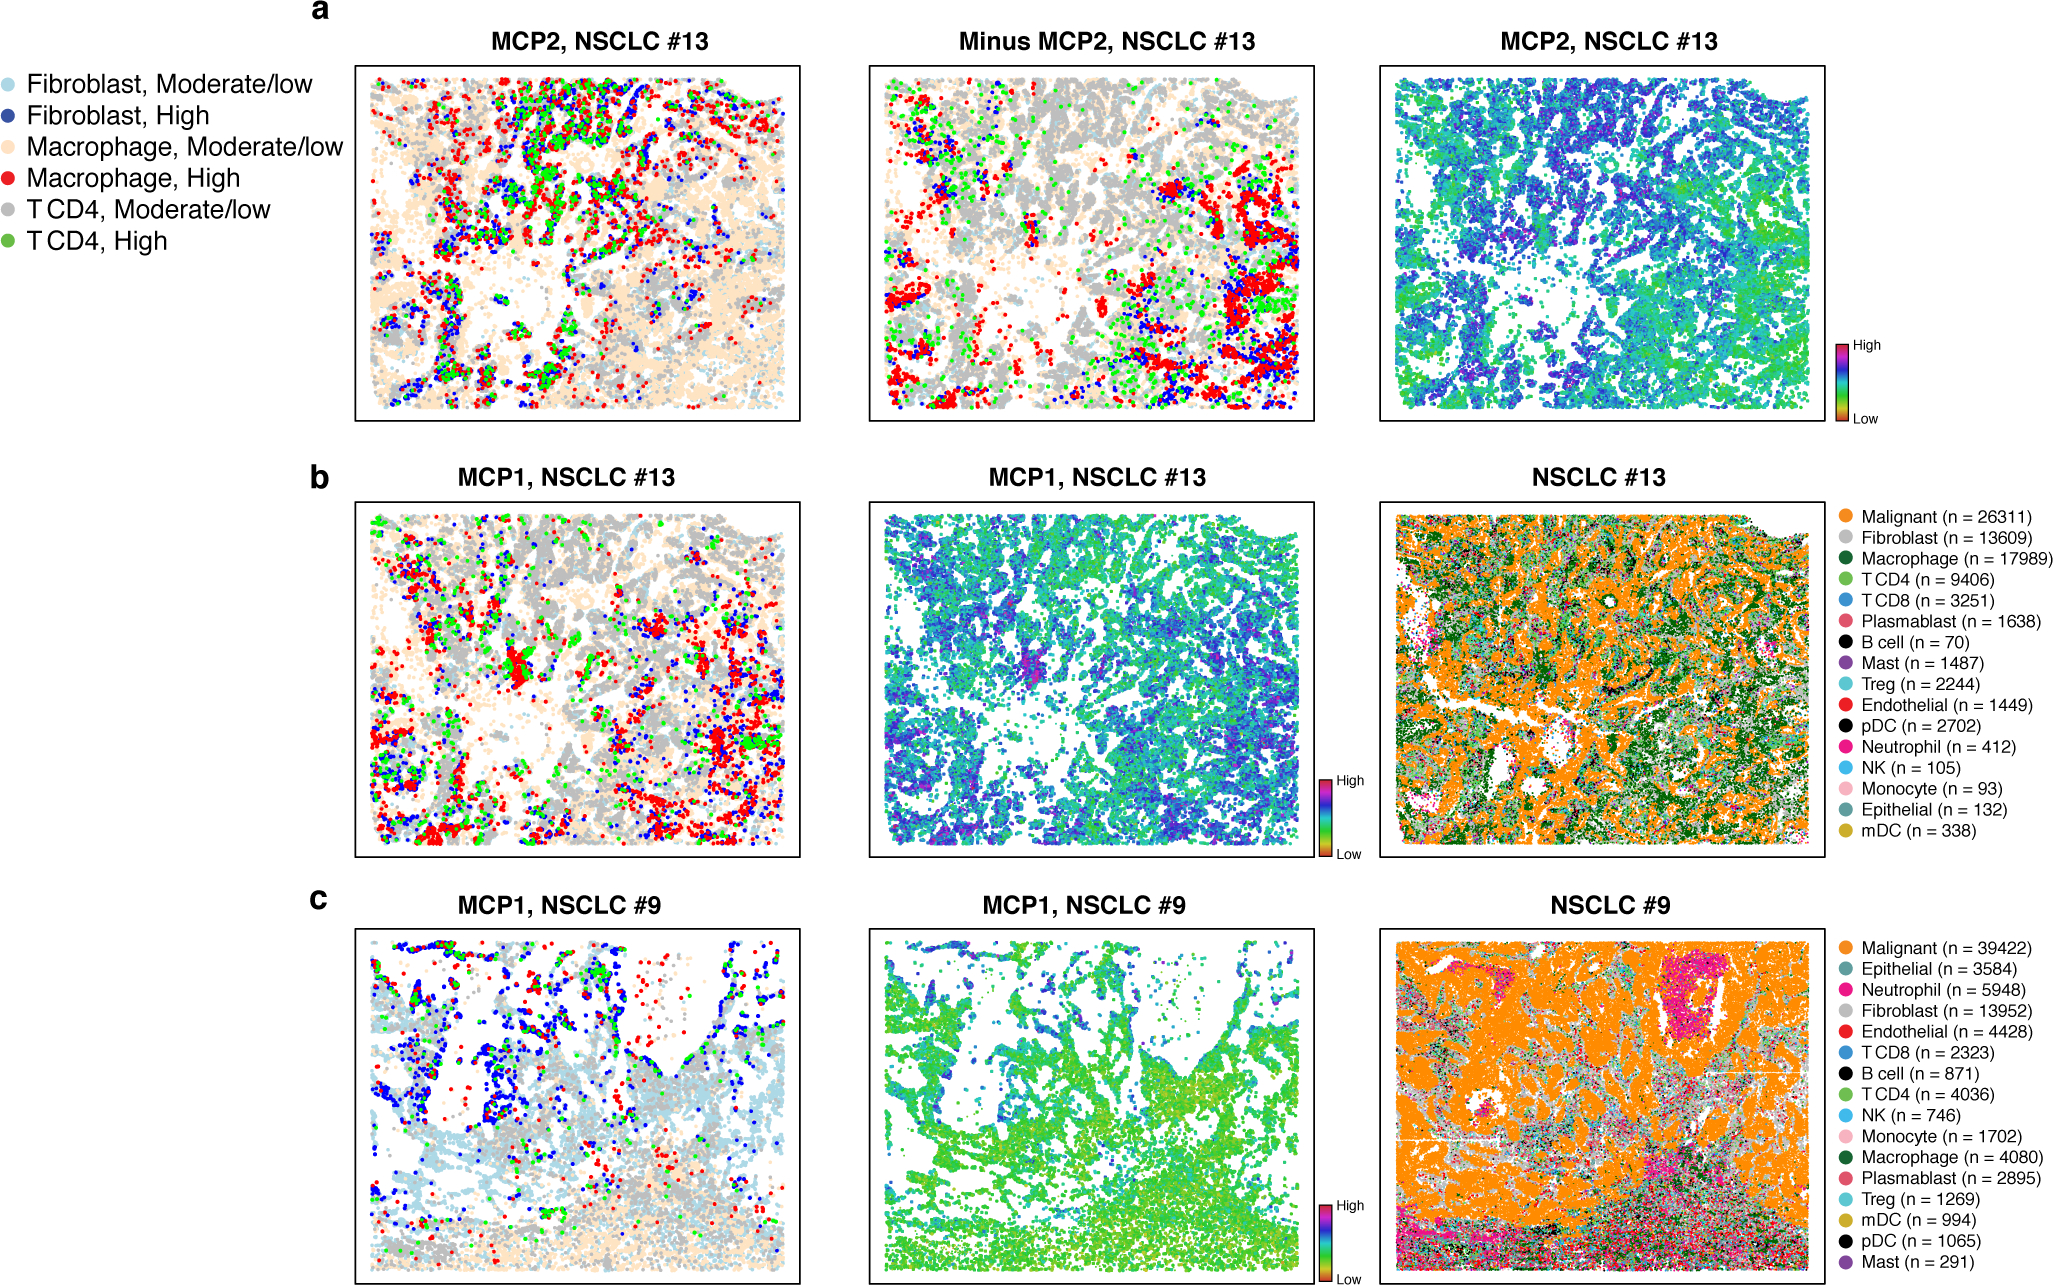
Figure 3. MCPs in NSCLC identify coordinated interferon responses in immune and stroma cells at the tumor edge.

Cell type assignments and MCPs in representative NSCLC tumors profiled by SMI data. (a) MCP2 in NSCLC tumor #13. Discretized expression (left, “High” > 80th percentile; “moderate/low” otherwise), its inverse (middle, highlighting cells with low MCP expression), and Overall Expression (right) of MCP2 of cells (dots) in the tumor spatial context. (b) MCP1 in NSCLC tumor #13. Discretized expression (left) and Overall Expression (middle) of MCP1, and cell type annotations (right) of cells (dots) in the tumor spatial context. (c) MCP1 in in NSCLC tumor #9. Discretized (left) and Overall Expression (middle) of MCP1 and cell type annotations (right) of cells (dots) in the tumor spatial context.
