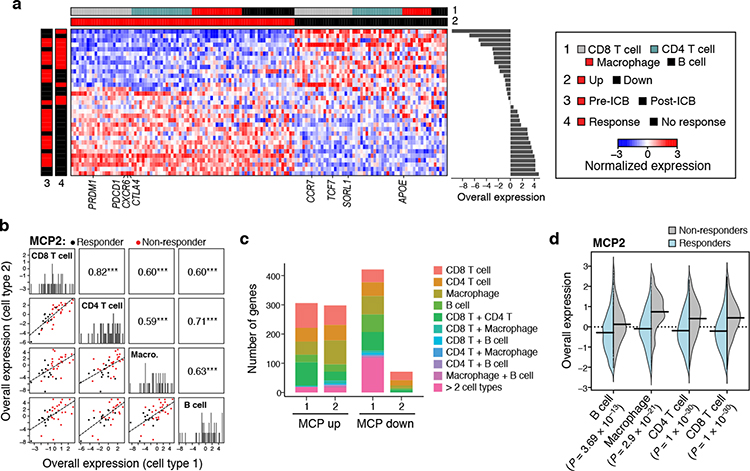
Figure 6. An immunotherapy resistance MCP in melanoma tumors, linking T cell dysfunction to APOE repression in macrophages.
(a) Melanoma multicellular ICB resistance program (MCP2). Average expression (Z score, red/blue color bar) of top genes (columns) from the ICB resistance program, sorted by their pertaining cell type (top color bar), across samples (rows), with samples sorted by Overall Expression (right, Online Methods), and labeled by treatment status and ICB response (left color bar). (b) ICB program components across cell types. Off diagonal panels: Comparison of Overall Expression scores (y and x axes) for each cell component of MCP2 (rows and columns, labels on diagonal) across the samples (dots, black: responding samples, red: non-responding samples); the lines correspond to the linear fit. Pearson correlation coefficient (r) and significance (***P < 1*10−3, one-sided) are shown in the upper triangle. Diagonal panels: Distribution of Overall Expression scores for each cell type component, along with the kernel density estimates. (c) Most genes in the ICB program are specific to one cell component. Number of genes (y axis) in the up (left bar) and down (right bar) compartment of the ICB program (x axis) that belong to one cell type component or multiple ones (color legend). (d) ICB multicellular program components are induced across cell types in ICB-resistant lesions. Distribution of Overall Expression scores (y axis) of ICB program components across the different cell types (y axis) for cells from non-responding (grey) and responding (light blue) lesions. P: One-sided p-values, mixed-effects models.

