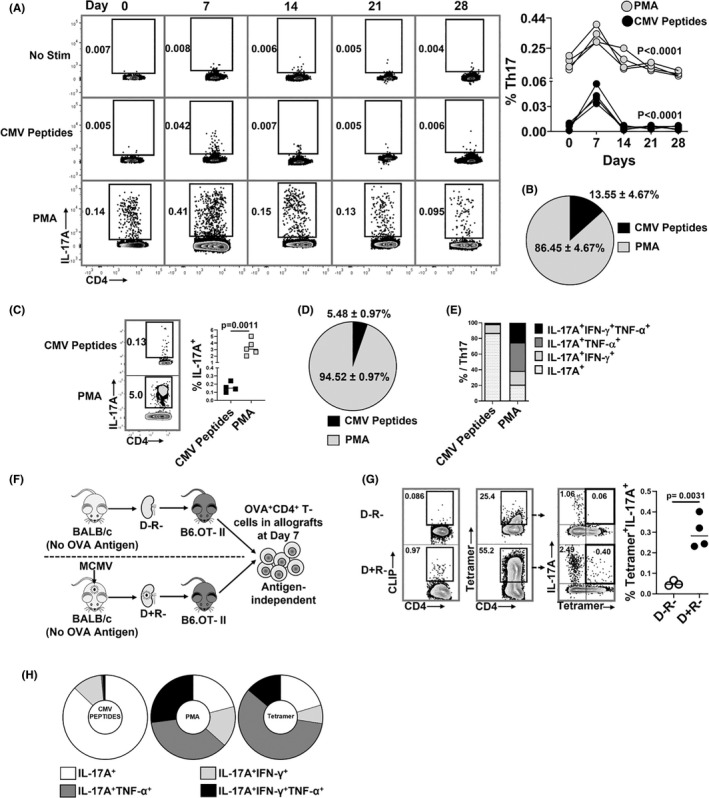
FIGURE 2.

MCMV‐specific and antigen‐independent Th17 cells infiltrate virus‐infected allografts. (A,‐B) Non‐transplant B6 mice were infected with MCMV on day 0 and splenic Th17 cell frequencies were quantified at days 0, 7, 14, 21, and 28 post‐infection. Splenocytes were stimulated with either PMA or MCMV peptides and stained for IL‐17A expressing CD4+ T cells. (A) Representative flow plots showing frequencies of MCMV‐specific and PMA+ Th17 cells at indicated days; graph shows frequencies of PMA+ (gray circles) and MCMV‐specific (black circles) Th17 cells over time. (B) Pie chart shows the percentages of MCMV‐specific and PMA+ Th17 cells in non‐transplant spleens at day 7 post‐infection. (C) Representative flow plots and frequencies of CMV‐specific (CMV peptides+) and total (PMA+) Th17 cells in allografts of D+R+ transplant recipients. (D) Pie chart shows percentages of MCMV‐specific and PMA+ Th17 cells in D+R+ allografts. (E) Proportions of intragraft Th17 cells expressing IL‐17A, IFN‐γ, and/or TNF‐α, compared between Th17 cells responding to MCMV peptides or PMA in D+R+ allografts. (F) Experimental design. B6.OT‐II transgenic recipients received D− or D+ allografts lacking expression of OVA antigen, so that OVA+ Th17 cells are recruited to allografts by antigen‐independent mechanisms. (G) OVA‐specific Th17 cells were detected using I‐Ab‐OVA323–339‐APC tetramer staining, with human CLIP‐APC tetramer used as control (Figure S3). Representative flow plots show tetramer staining of CD4+ T cells derived from D−R− and D+R+ allografts. Graph shows the frequencies of OVA tetramer+ Th17 cells compared between the groups. (H) Cytokine expression profiles were compared for intragraft MCMV specific and PMA+ Th17 cells in wild‐type recipients, and for OVA tetramer+ Th17 cells from OTII recipients. Data are represented as mean ± standard deviation (SD) and are analyzed by two‐sided Student's t‐test (C,G) or one‐way ANOVA (A).
