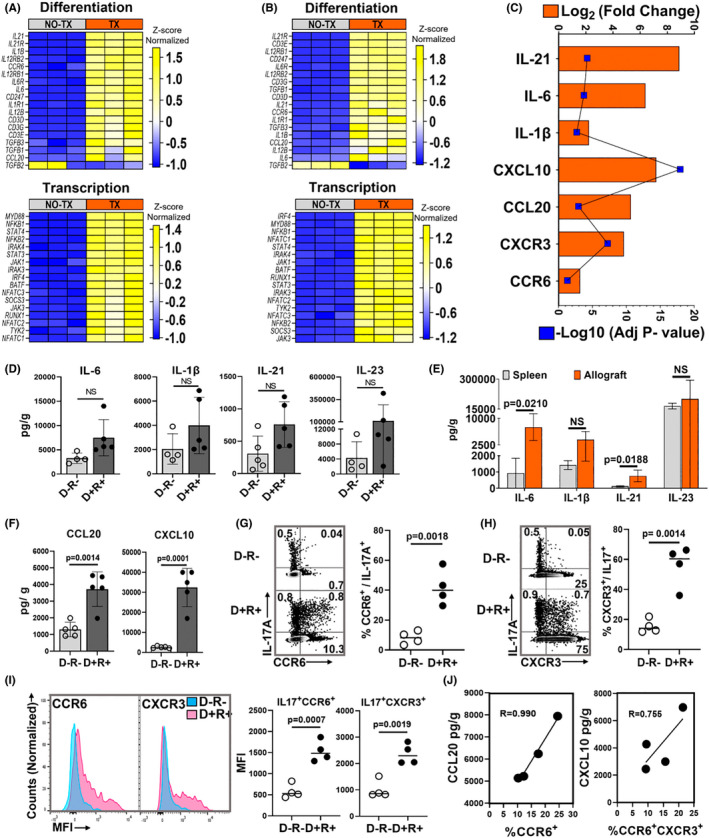
FIGURE 3.

MCMV‐infected allograft microenvironment favors Th17 cell recruitment. (A–C) Gene expression profiles by RNA‐seq. (A) Heat map shows differentially expressed genes encoding molecules required for Th17 cell differentiation and transcription factors between D+ allografts (TX) and infected non‐transplant kidneys (NO‐TX) and (B) differentially expressed Th17 cell‐related genes between D− allografts (TX) and uninfected non‐transplant kidneys (NO‐TX). Each column represents a single sample whereas rows represent intensities of gene expression. Hierarchical clustering of the genes was performed based on the average column z‐score, highest (top) to lowest (bottom). (C) Transcripts for Th17 cell differentiating cytokines and recruiting chemokines are upregulated in D+ transplants compared to MCMV‐infected native kidneys. (D) Comparison of intragraft Th17 cell differentiating cytokine quantities between D−R− and D+R+ transplants. (E) Quantities of Th17 cell differentiating cytokines in D+R+ spleens and allografts. (F) Comparison of Th17 cell recruiting chemokine quantities in D−R− and D+R+ allografts. (G,H) Representative flow plots and frequencies of CCR6+ and CXCR3+ Th17 cells in D−R− and D+R+ allografts. (I) Mean fluorescence intensity (MFI) of CCR6 and CXCR3 expression for Th17 cells from D−R− (blue) and D+R+ (pink) allografts. (J) Correlation between intragraft chemokines and receptors expressed by Th17 cells from D+R+ transplants. All data are represented as mean ± standard deviation (SD) and are analyzed by two‐sided Student's t‐test or Pearson correlation. NS, not significant (p > .05)
