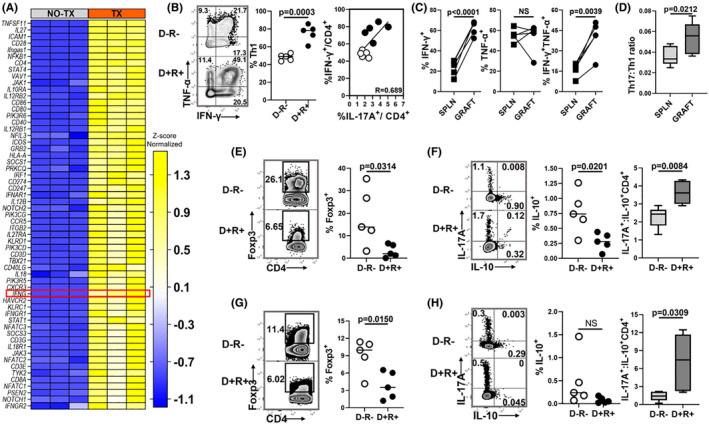
FIGURE 5.

MCMV infection is associated with increased Th1 cells and decreased Tregs. (A) Heat map shows differential expression of transcripts involved with Th1 cell activation in D+ allografts (TX) compared to non‐transplant MCMV‐infected kidneys (NO TX). Hierarchical clustering of the genes was performed based on the average column z‐score, highest to lowest. (B) Representative flow plots and frequencies of Th1 cells in D−R− and D+ R+ allografts. Intragraft frequencies of Th17 cells were correlated with Th1 cells in D−R− and D+ R+ transplants. (C) Frequencies of IFN‐γ and/or TNF‐α expressing Th1 cells in D+R+ spleens and allografts. (D) Ratio of Th17:Th1 cell infiltrates in D+R+ spleens and allografts. (E,F) Representative flow plots and frequencies of (E) Foxp3+ Tregs and (F) IL‐10 expressing Tregs in allografts. (F) Box plot shows ratio of Th17:Treg cells (IL‐17A+: IL‐10+ CD4+). (G,H) Representative flow plots and frequencies of (G) Foxp3+ Tregs and (H) IL‐10 expressing Tregs in spleens. (H) Box plot shows ratio of Th17:Treg cells in spleens. All data are represented as mean ± standard deviation (SD) and are analyzed by two‐sided Student's t‐test or Pearson correlation. NS, not significant (p > .05)
