
Figure 2. Summary of SNF analysis.
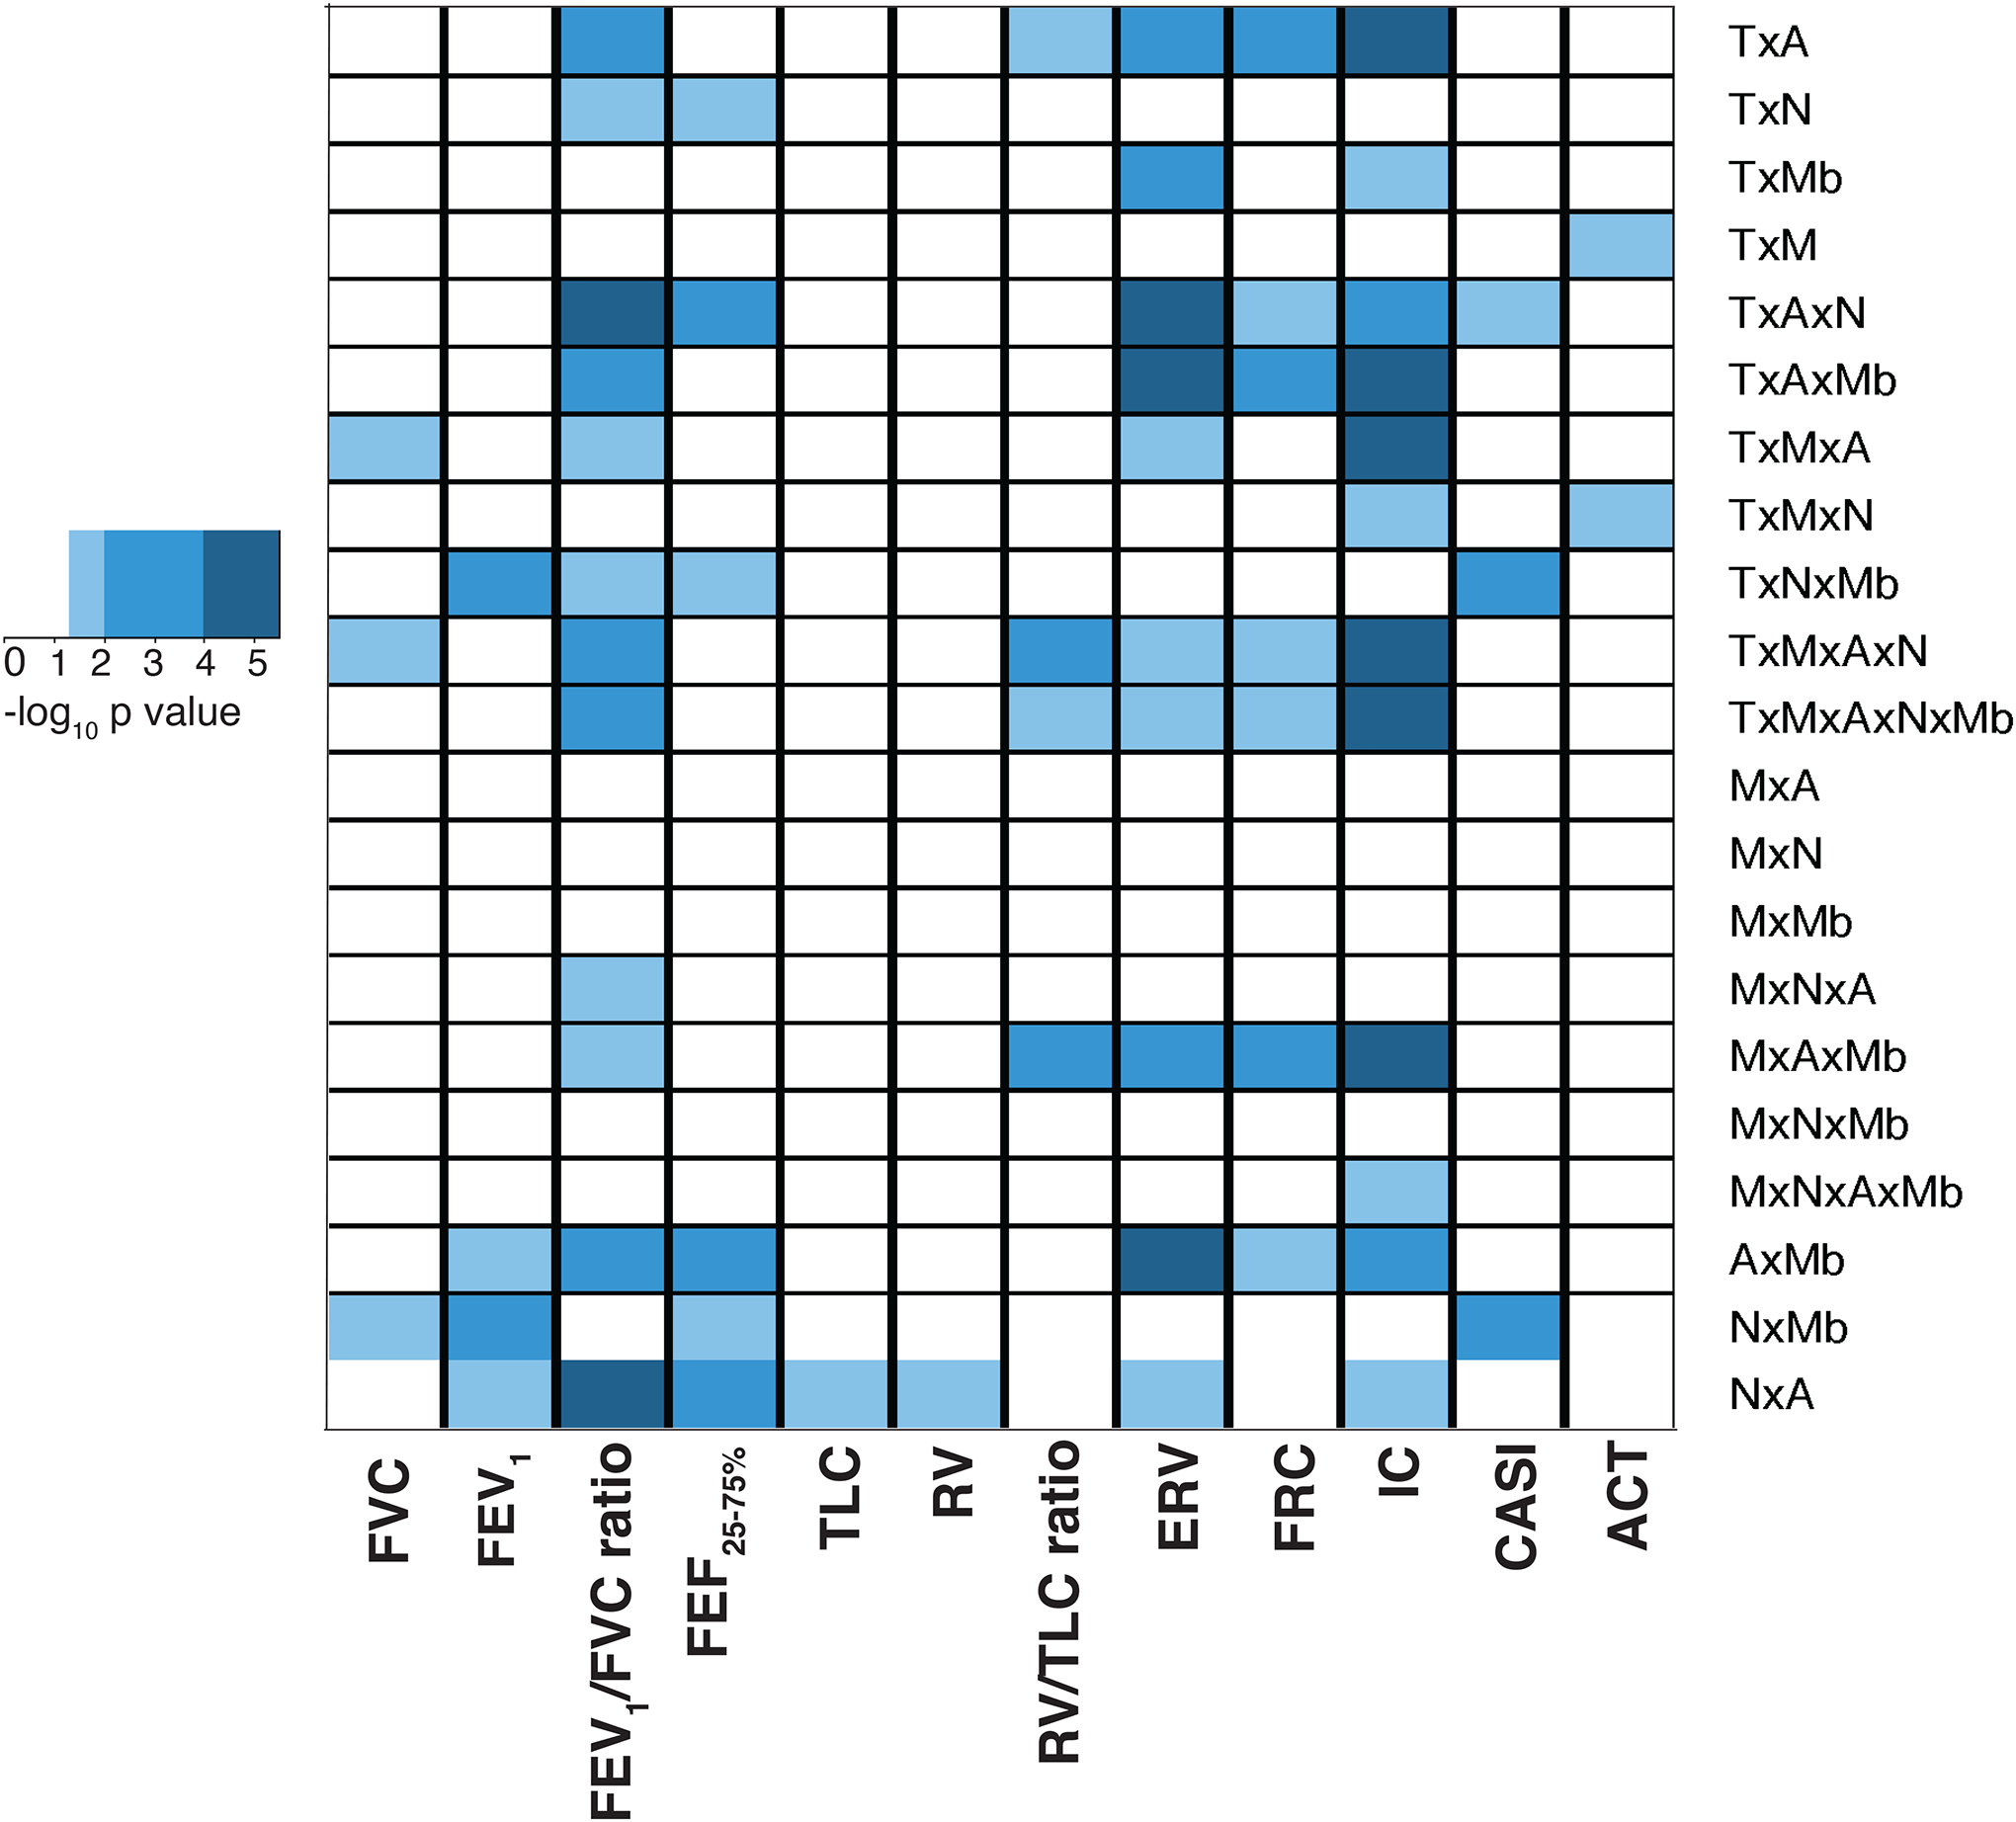
The heatmap reports the signficance of prediction of CASI, ACT and pulmonary function indices, plotted on the x-axis, by the sample clusters, determined by SNF tool, for each of the 21 different combinations of the 5 predictive datasets, including anthropometric measures (A), metabolic measures (Mb), nutrient levels (N), and Th cell transcriptome (T) and DNA methylome (M), plotted on y-axis. The color key summarizes the significance of the predictive ability of the sample clusters within each combination, for CASI, ACT or pulmonary function index. White denotes an association that did not reach statistical significance (p=>0.05); light blue denotes associations with p<0.05 and ≥0.01, intermediate shade of blue denotes associations with p<0.01 and ≥0.0001, and dark blue denotes associations with p<0.0001.