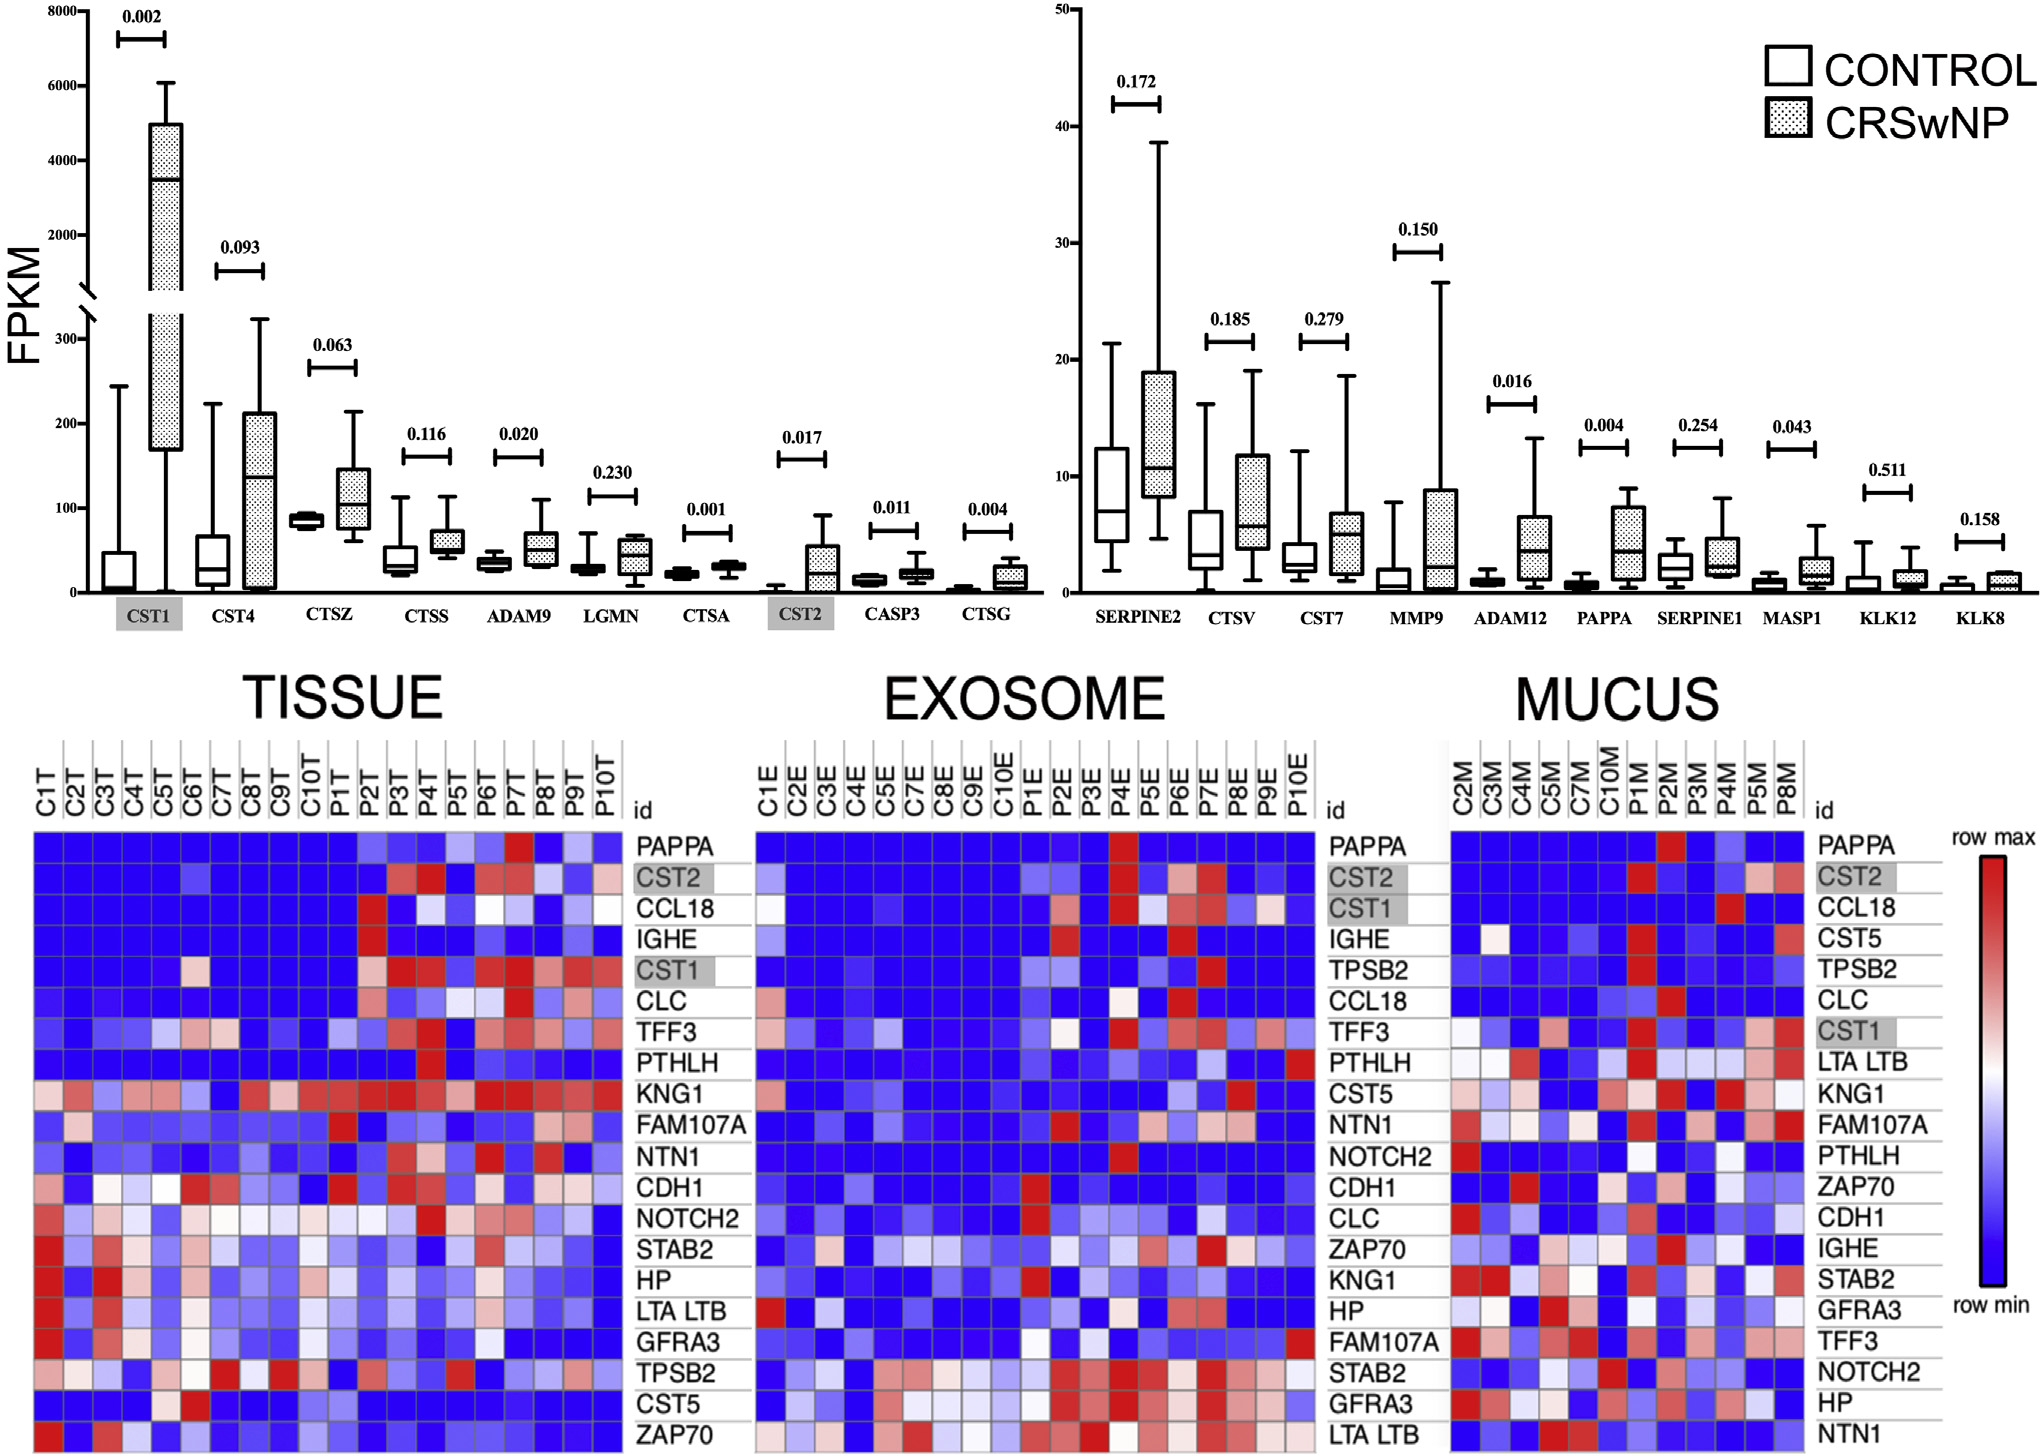
FIG 1.

Proteomics data on matched clinical samples. Top row, Box and whisker plots of tissue mRNA expression (by fragments per kilobase of transcript per million mapped reads [FPKM]) of the top 20 protease and protease inhibitors included in the proteomic array. Note that CST1 has both the highest expression in CRSwNP and the greatest FC relative to the control (73.1; CST2 FC = 18.4) among the proteins examined. Bottom row, Heatmaps of top 20 proteins by FC. Individual boxes represent protein concentration by RFU) within matched tissue, exosome, and mucus samples among the entire 1305-protein SOMAscan array. Note that CST1 and CST2 are among the most overexpressed proteins across all CRSwNP sample sources. Data represent 10 control patients (C) and 10 patients with CRSwNP (P).
