
Figure 3.
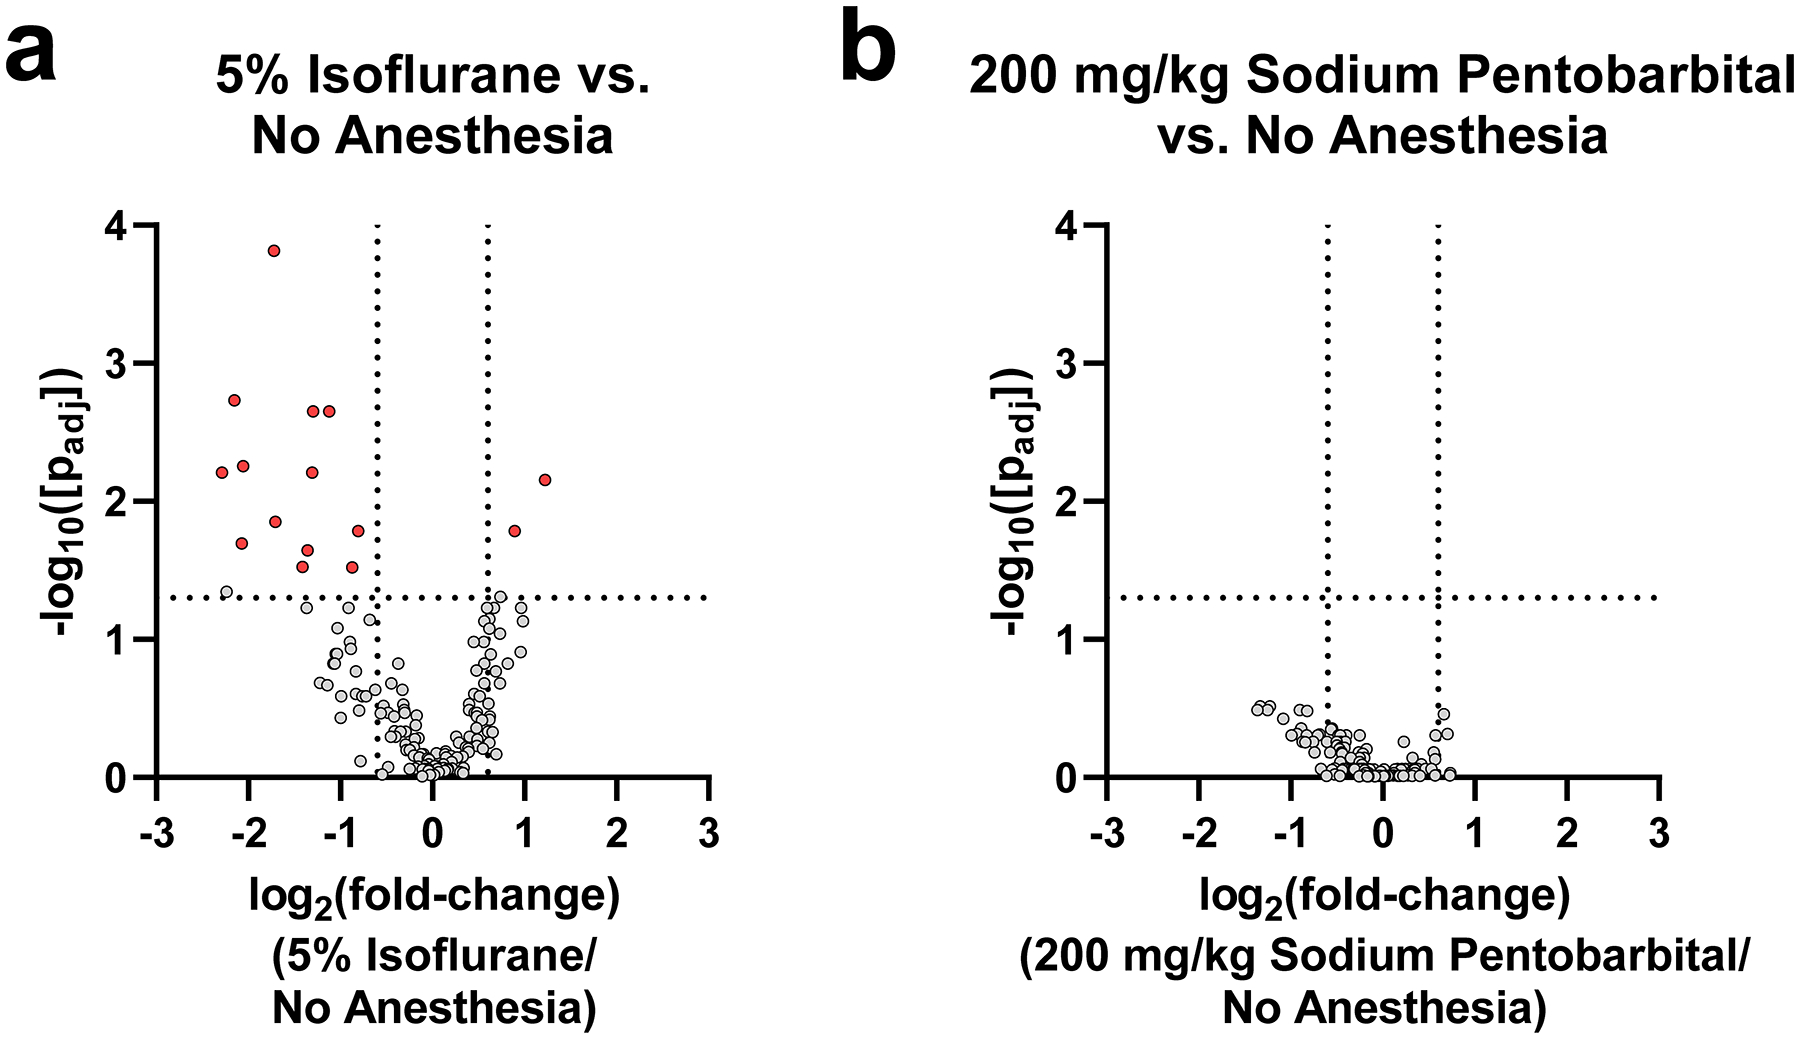
Volcano plots comparing pituitary peptide changes for (a) “5% Isoflurane” or (b) “200 mg/kg Sodium Pentobarbital” compared to “No Anesthesia” condition. Red data points indicate significantly changing peptides (passing both parametric and non-parametric tests) with a log2(fold-change) > 0.6 or < −0.6. The two vertical lines are demarcation points for the log2(fold-change) > 0.6 or < −0.6 between the groups. The horizontal line marks a corrected p-value of 0.05. Grey points above this horizontal line did not pass both the parametric and non-parametric tests.