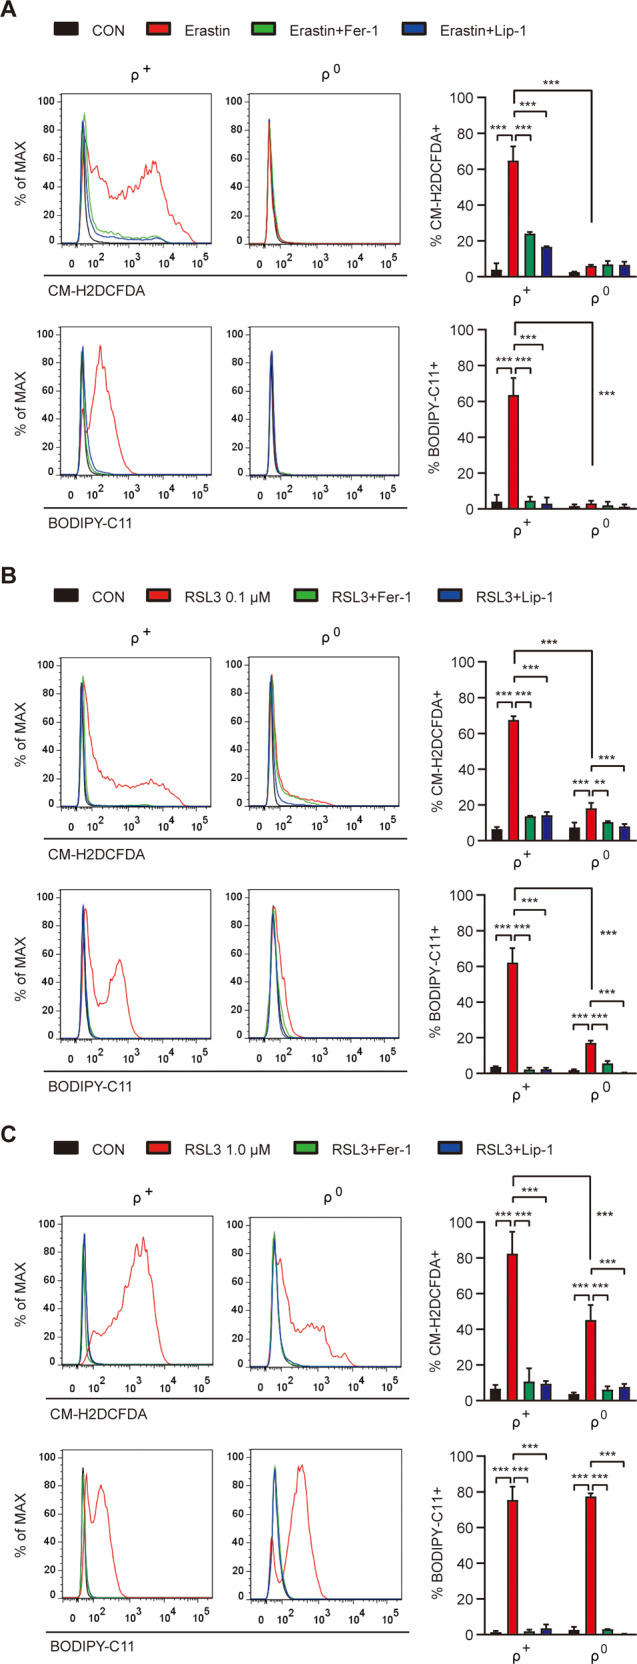
Fig. 2. Reduced accumulation of ROS and lipid peroxides in SK-Hep1 ρ0 cells.

A SK-Hep1 ρ+ and ρ0 cells were treated with 5 μM erastin in the presence or absence of 2.5 μM Fer-1 or 0.1 μM Lip-1 for 16 h and then analyzed for cellular ROS and lipid peroxides by flow cytometry after staining with CM-H2DCFDA and BODIPY-C11, respectively (right). Representative histograms are shown (left panel). B, C SK-Hep1 ρ+ and ρ0 cells were treated with 0.1 (B) or 1.0 μM (C) RSL3 in the presence or absence of 2.5 μM Fer-1 or 0.1 μM Lip-1 for 4 h, and then analyzed for cellular ROS and lipid peroxides, as in A (right). Representative histograms are shown (left panel). Data represent means ± SD from three independent experiments. Data were analyzed by one-way ANOVA with Tukey’s multiple comparison test (A–C except ρ+ and ρ0 comparison) or two-tailed unpaired Student’s t test (ρ+ and ρ0 cell comparisons in A–C). (*p < 0.05; **p < 0.01; ***p < 0.001; ****p < 0.0001; ns, not significant).
