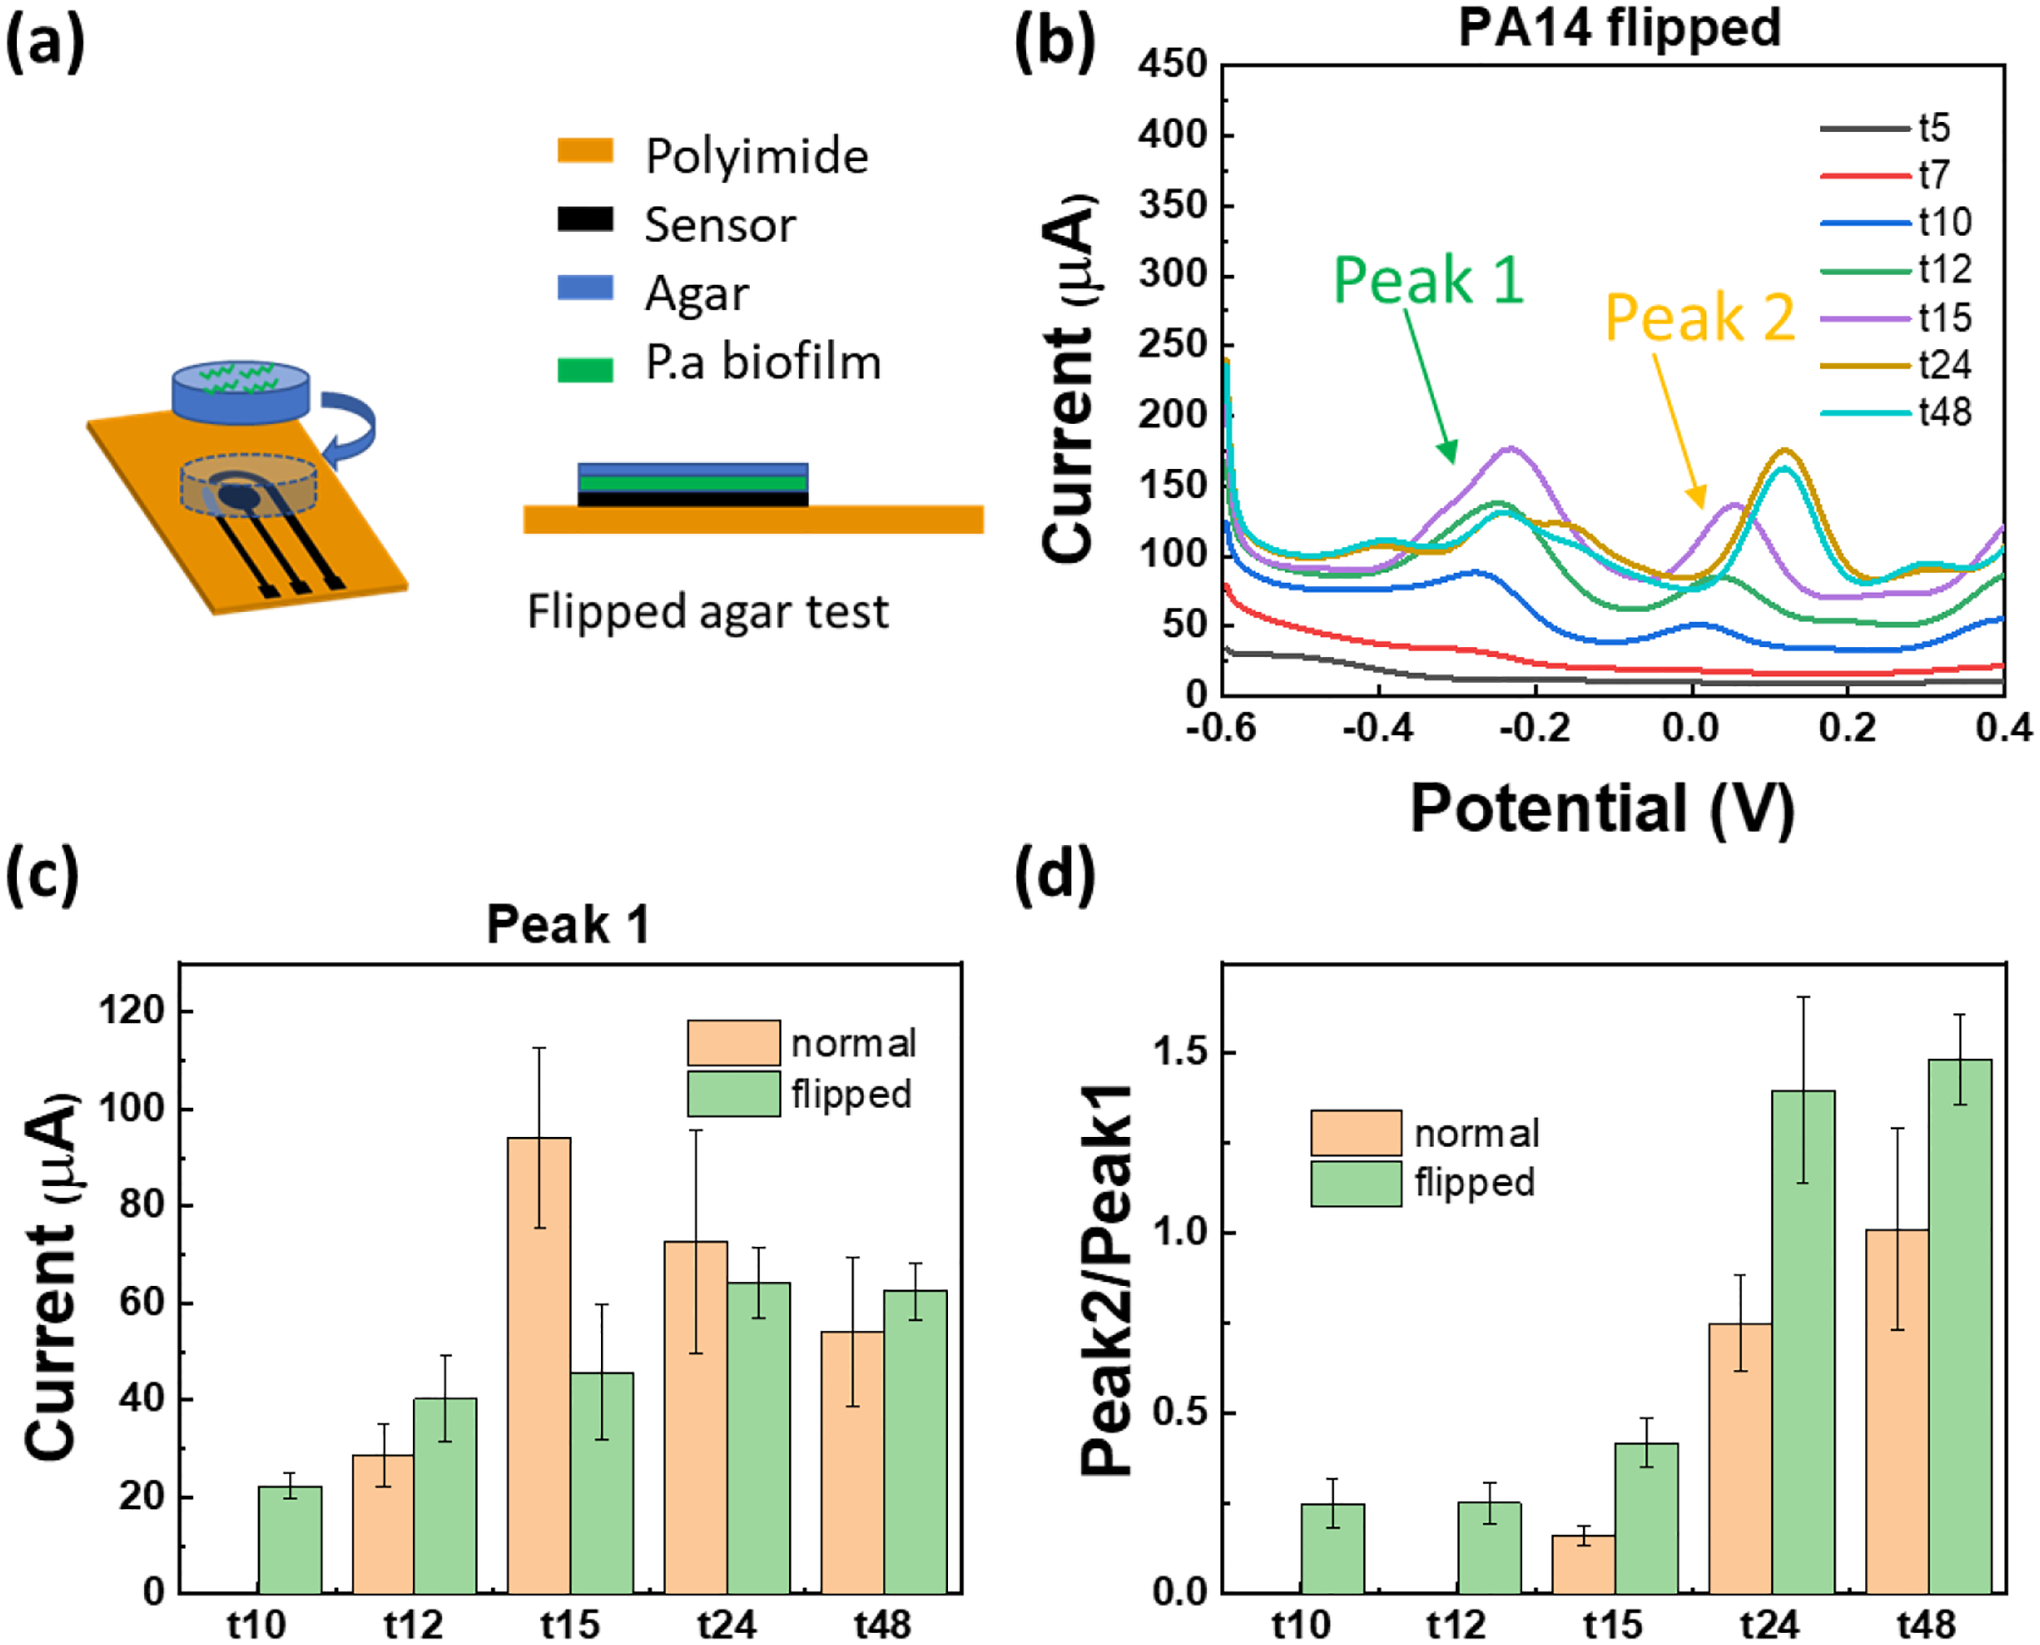
Figure 6.

(a) Schematic of the “Flipped agar test”, i.e. when cells are in direct contact with the sensor. (b) SWV of flipped agar test with PA14 (seeded at initial cell number of 1.4×10⁵ CFU over agar). (c) Comparison of the two test configurations in this study (“Normal” vs “Flipped”). The current of peak 1 at about – 0.25 V is plotted which corresponds to PYO and PCA (they usually overlap in PA biofilms). (d) The ratio of SWV current at peak 1 and peak 2 (shown by arrow in part b) as a function of time with two testing configurations is plotted, showing that the phenazines synthesis/interplay varies with time. The peak ratio from each SWV curve is calculated individually and the average and standard error are plotted. “Normal” includes data from three sensors (two SWV scans from each sensor) and for “Flipped” configuration, data from four sensors is included (two SWV scans from each sensor).
