Figure 1.
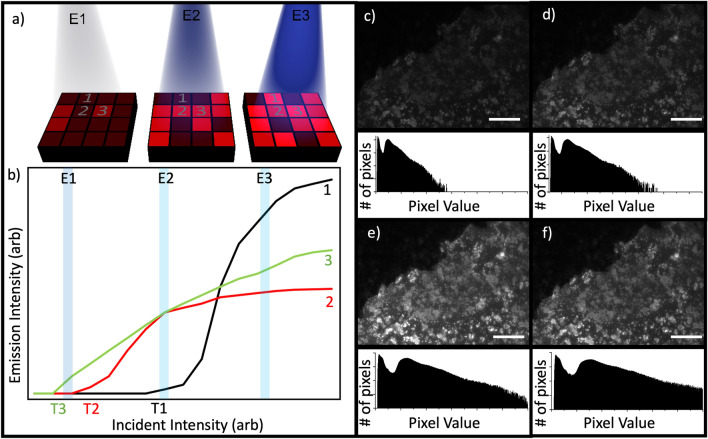
The concept of using the non-linear response of a quantum dot-based tag for authentication. (a) Illustrates a security tag’s surface, coated in quantum dots and divided into pixels for clarity. As the incident illumination increases (from left to right at 3 excitation powers, E1, E2, E3) the average amount of photoluminescence (shown in red) increases, but at different rates from region to region. T1, T2 and T3 show the switch-on intensities of different QD regions. (b) Sketches how the photoluminescence intensity from three example locations could vary differently with increasing excitation. (c)–(f) The top section of each panel shows photoluminescence from a thin film containing colloidal quantum dots at increasing excitation power, with pixel histograms underneath displaying the number of pixels recording each intensity value (0 to 65,355) at the different incident powers: 36.4 μW (c), 57.6 μW (d), 91.4 μW (e), and 145 μW (f). Scale bar represents 50 μm.

