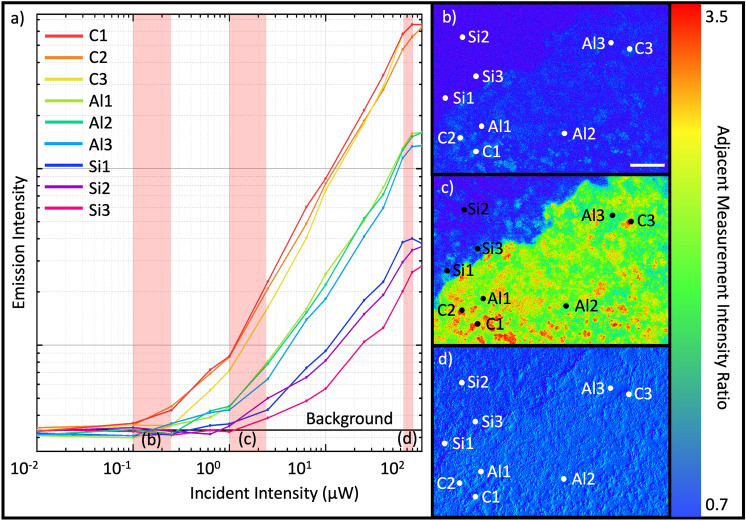
Figure 2.
The non-linear optical response of a colloidal quantum dot film. (a) Log–log plot showing the emission intensity from a series of points chosen to represent 3 different region types on the sample: QDs on the Si substrate (labels Si1-3), QDs on the Al layer (Al1-3), and QD clusters on the surface (C1-3). (b)–(d) Show images created by taking the ratio of emission intensity maps recorded at adjacent excitation intensities. These are (b) 0.4/0.15 μW, (c) 3.6/1.4 μW and (d) 115/90 μW. Scale bar represents 50 μm. Z scale represents the relative difference in point-to-point variation on the sample surface.

