
Fig. 2. In silico flux analysis for metabolic reactions in the sphingolipid pathway.
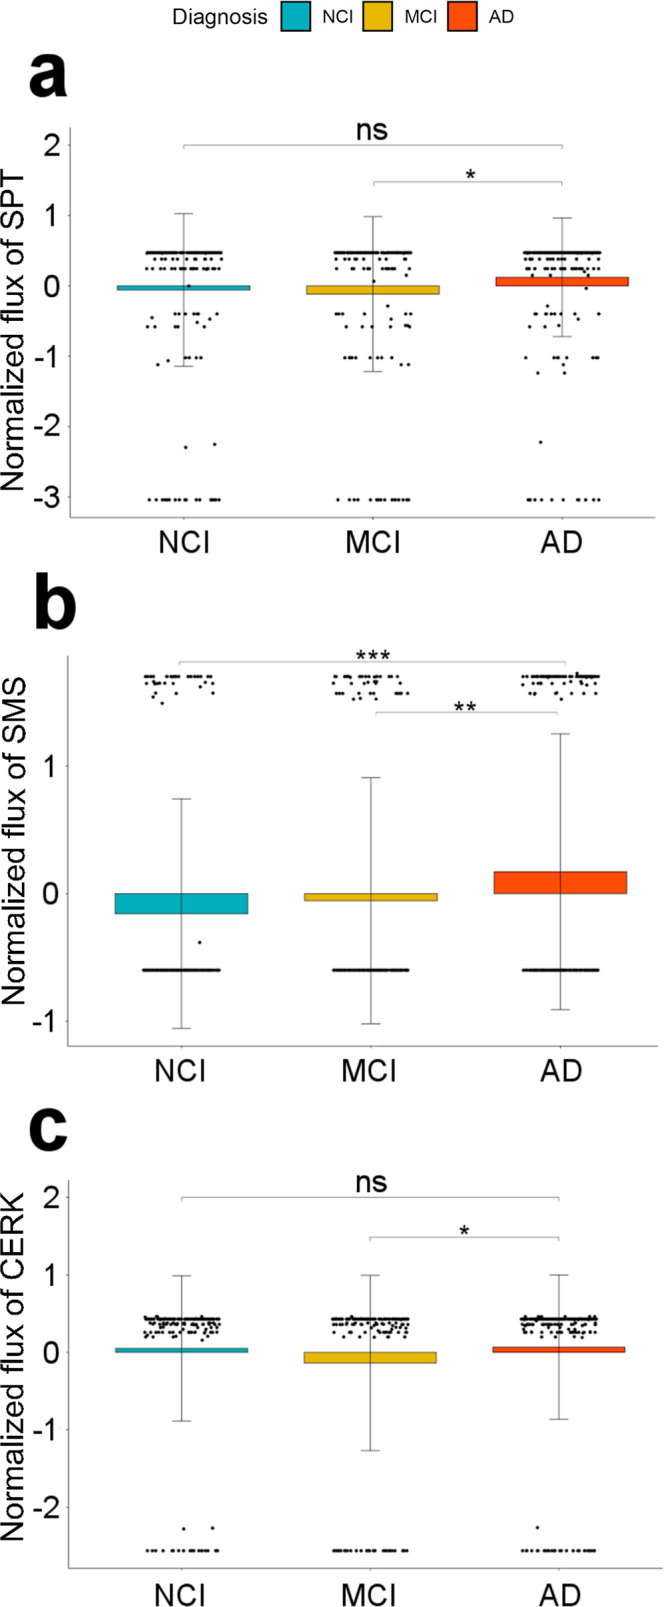
Box plot of normalized reaction fluxes for a serine palmitoyl transferase (SPT), b sphingomyelin synthase (SMS), and c ceramide kinase (CERK) reactions. The orange, mustard yellow, and blue bars correspond to Alzheimer’s Disease (AD), mild cognitive impairment (MCI), and no cognitive impairment (NCI). ∗p < 0.05, ∗∗p < 0.01, ∗∗∗p < 0.001, and ns is non-significant.