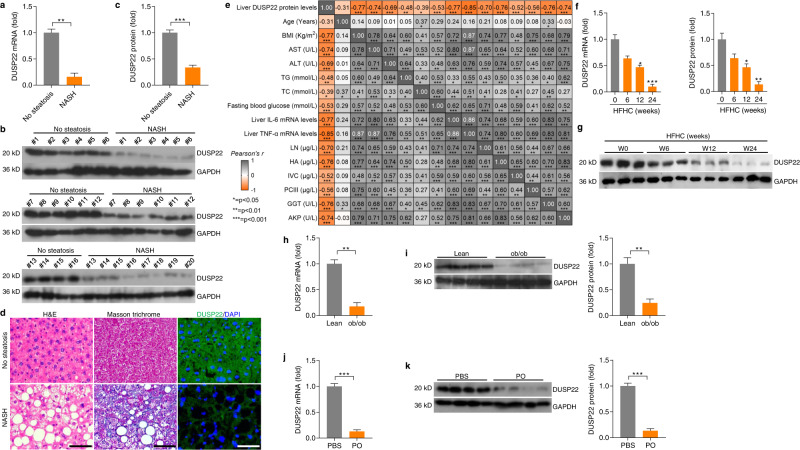
Fig. 1. DUSP22 is downregulated in fatty liver.
a RT-qPCR analysis for DUSP22 mRNA levels in livers of individuals without (No steatosis; n = 16) or with NASH (n = 20) (**P < 0.01). b, c Representative western blotting analysis (b) and quantification (c) of DUSP22 protein expression in livers of individuals without (No steatosis; n = 16) or with NASH (n = 20) (***P < 0.001). d Liver sections from individuals without (up) or with NASH (down) were stained with H&E (left), Masson trichrome (middle) and immunofluorescence (right) examination for DUSP22 expression (green) (n = 8 per group, with 10 images for each sample; Scale bars, 50 µm). e Pearson multiple correlation among all parameter indexes gathered from No steatosis and NASH individuals (n = 36 per parameter). Orange color shows negative correlation, gray color shows positive color correlation; strong colors tonality identifies strongest correlation. f, g Analysis of f RT-qPCR and g western blotting for DUSP22 mRNA and protein levels, respectively, in the livers of WT C57BL/6N mice fed a HFHC at the indicated time of weeks (n = 3 per group) (*P < 0.05 and ***P < 0.001 versus the expression at HFHC-0 week group). h, i Analysis of h RT-qPCR and i western blotting for DUSP22 mRNA and protein levels, respectively, in the livers from the lean or ob/ob mice (n = 4 per group) (**P < 0.01). j, k Analysis of j RT-qPCR and k western blotting for DUSP22 mRNA and protein levels, respectively, in the isolated primary hepatocytes followed by BSA or PO treatment (0.4 mM PA and 0.8 mM OA) for 24 h (n = 4 per group) (***P < 0.001). Data are expressed as mean ± SEM from at least three independent experiments. For statistical analysis, a, c, h–k were carried out by two-tailed Student’s t-test; f and g were performed by one-way ANOVA.

