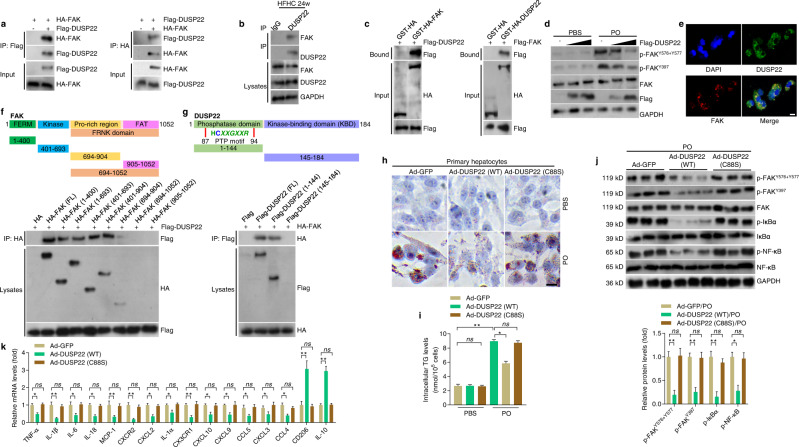
Fig. 5. DUSP22 directly interacts with FAK to regulate NASH.
a Results by Co-IP assays in L02 cells transfected with Flag-tagged DUSP22 and HA-tagged FAK. Anti-Flag and anti-HA antibodies were used as immunoblotting probes. b Immunoprecipitation and western blotting analysis indicating the binding of DUSP22 and FAK in liver WT mice after a 24-week HFHC, and IgG was served as a control. c GST precipitation analysis presenting the direct DUSP22-FAK binding. Purified GST was used as a control. d Representative western blotting of total FAK, p-FAKY576+577, and p-FAKY397 in L02 cells transfected with different amounts of Flag-tagged DUSP22 with PO or BSA treatment for 24 h. e Representative immunofluorescent staining of L02 cells co-transfected with Flag-tagged DUSP22 (green) and HA-tagged FAK (red) after transfection for 24 h (n = 10 images in total; Scale bar, 10 µm). f, g Schematic showing full-length (FL) and truncated f FAK (top) and g DUSP22 (top) with representative Co-IP analysis (bottom) for the mapping analysis of the domains responsible for the DUSP22-FAK interaction in L02 cells. h, i Representative Oil red O staining images (h) and intracellular TG contents (i) indicating the lipid deposition in PO-treated Ad-DUSP22 (WT) or Ad-DUSP22 (C88S)-transfected primary hepatocytes for 24 h. primary hepatocytes transfected with Ad-GFP were used as a control (n = 5 per group, with 10 images per group; Scale bar, 25 µm) (*P < 0.05 and **P < 0.01; ns no significant difference). j Representative western blotting of phosphorylated and total total FAK, IκBα, and NF-κB in primary hepatocytes transfected with GFP, WT DUSP22 or the C88S DUSP22 variant at 24 h after PO treatment (n = 3 per group) (*P < 0.05 and **P < 0.01; ns no significant difference). k RT-qPCR analysis showing inflammation-related crucial genes expression changes in PO-treated Ad-DUSP22 (WT) or Ad-DUSP22 (C88S)-transfected primary hepatocytes for 24 h (n = 6 per group) (*P < 0.05 and **P < 0.01; ns no significant difference). Data are expressed as mean ± SEM from at least three independent experiments. For statistical analysis, i–k were performed by two-tailed Student’s t-test.

