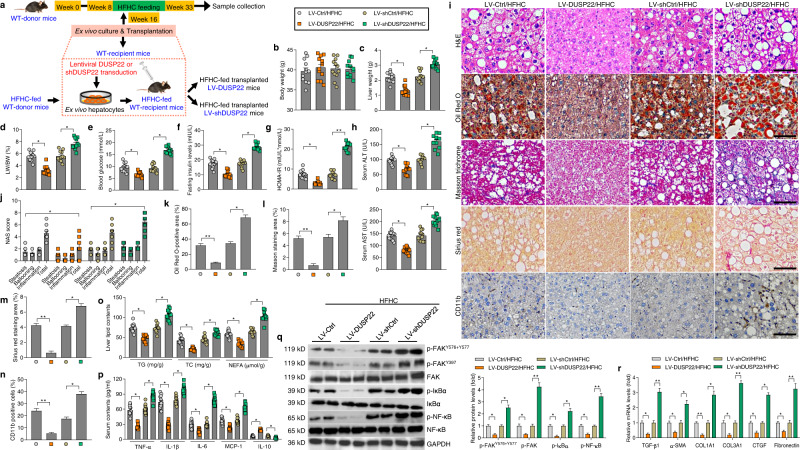
Fig. 7. DUSP22 protects against HFHC-induced NASH pathologies.
a Scheme showing the ex vivo-regulated gene therapy. Primary hepatocytes from the preconditioned WT mice fed with an 8-week HFHC as donor were isolated and ex vivo cultured. The cultured hepatocytes were then transduced with lentivirus-loaded DUSP22 or shDUSP22 sequences. The corresponding blank vector were used as controls. Subsequently, the additional HFHC-fed littermates mice as recipient were injected with the transduced hepatocytes through portal vein. The HFHC-fed transplanted mice (HFHC LV-DUSP22 or HFHC LV-shDUSP22) were thereafter fed with a HFHC diet for an additional 16 weeks. b–h Measurements of b body weight, c liver weight, d ratio of LW/BW, e blood glucose levels, f fasting insulin levels, g HOMA-IR index, and h serum ALT and AST (n = 12 mice per group) (*P < 0.05 and **P < 0.01). i Representative images of H&E staining, Oil Red O staining, Masson trichrome staining, Sirius red staining and immunohistochemistry examination of CD11b in liver sections from the shown groups of mice (n = 6 or 12 mice per group, with 10 images for each mouse; Scale bars, 50 µm). j–n Results for j NAS score, k Oil Red O-positive staining, l Masson trichrome-positive staining, m Sirius red-positive staining, and n CD11b-positive cells were analyzed and quantified (n = 6 or 12 mice per group) (*P < 0.05 and **P < 0.01). o Examination of TG, TC, and NEFA in hepatic tissues from the indicated groups of mice (n = 12 mice per group) (*P < 0.05). p Assessments of serum TNF-α, IL-1β, IL-6, MCP-1, and IL-10 contents from the shown groups of mice (n = 11 mice per group) (*P < 0.05). q Representative western blotting and quantification of the protein expression of total and phosphorylated FAKY576+Y577, FAKY397, IκBα, and NF-κB in liver from the shown groups of mice (n = 4 mice per group) (*P < 0.05 and **P < 0.01). r RT-qPCR results for mRNA levels of fibrosis-related genes including TGF-β1, α-SMA, COL1A1, COL3A1, CTGF, and Fibronectin in liver of the indicated groups of mice (n = 8 mice per group) (*P < 0.05 and **P < 0.01). Data are expressed as mean ± SEM from at least three independent experiments. Statistical analysis were performed by two-tailed Student’s t-test.

