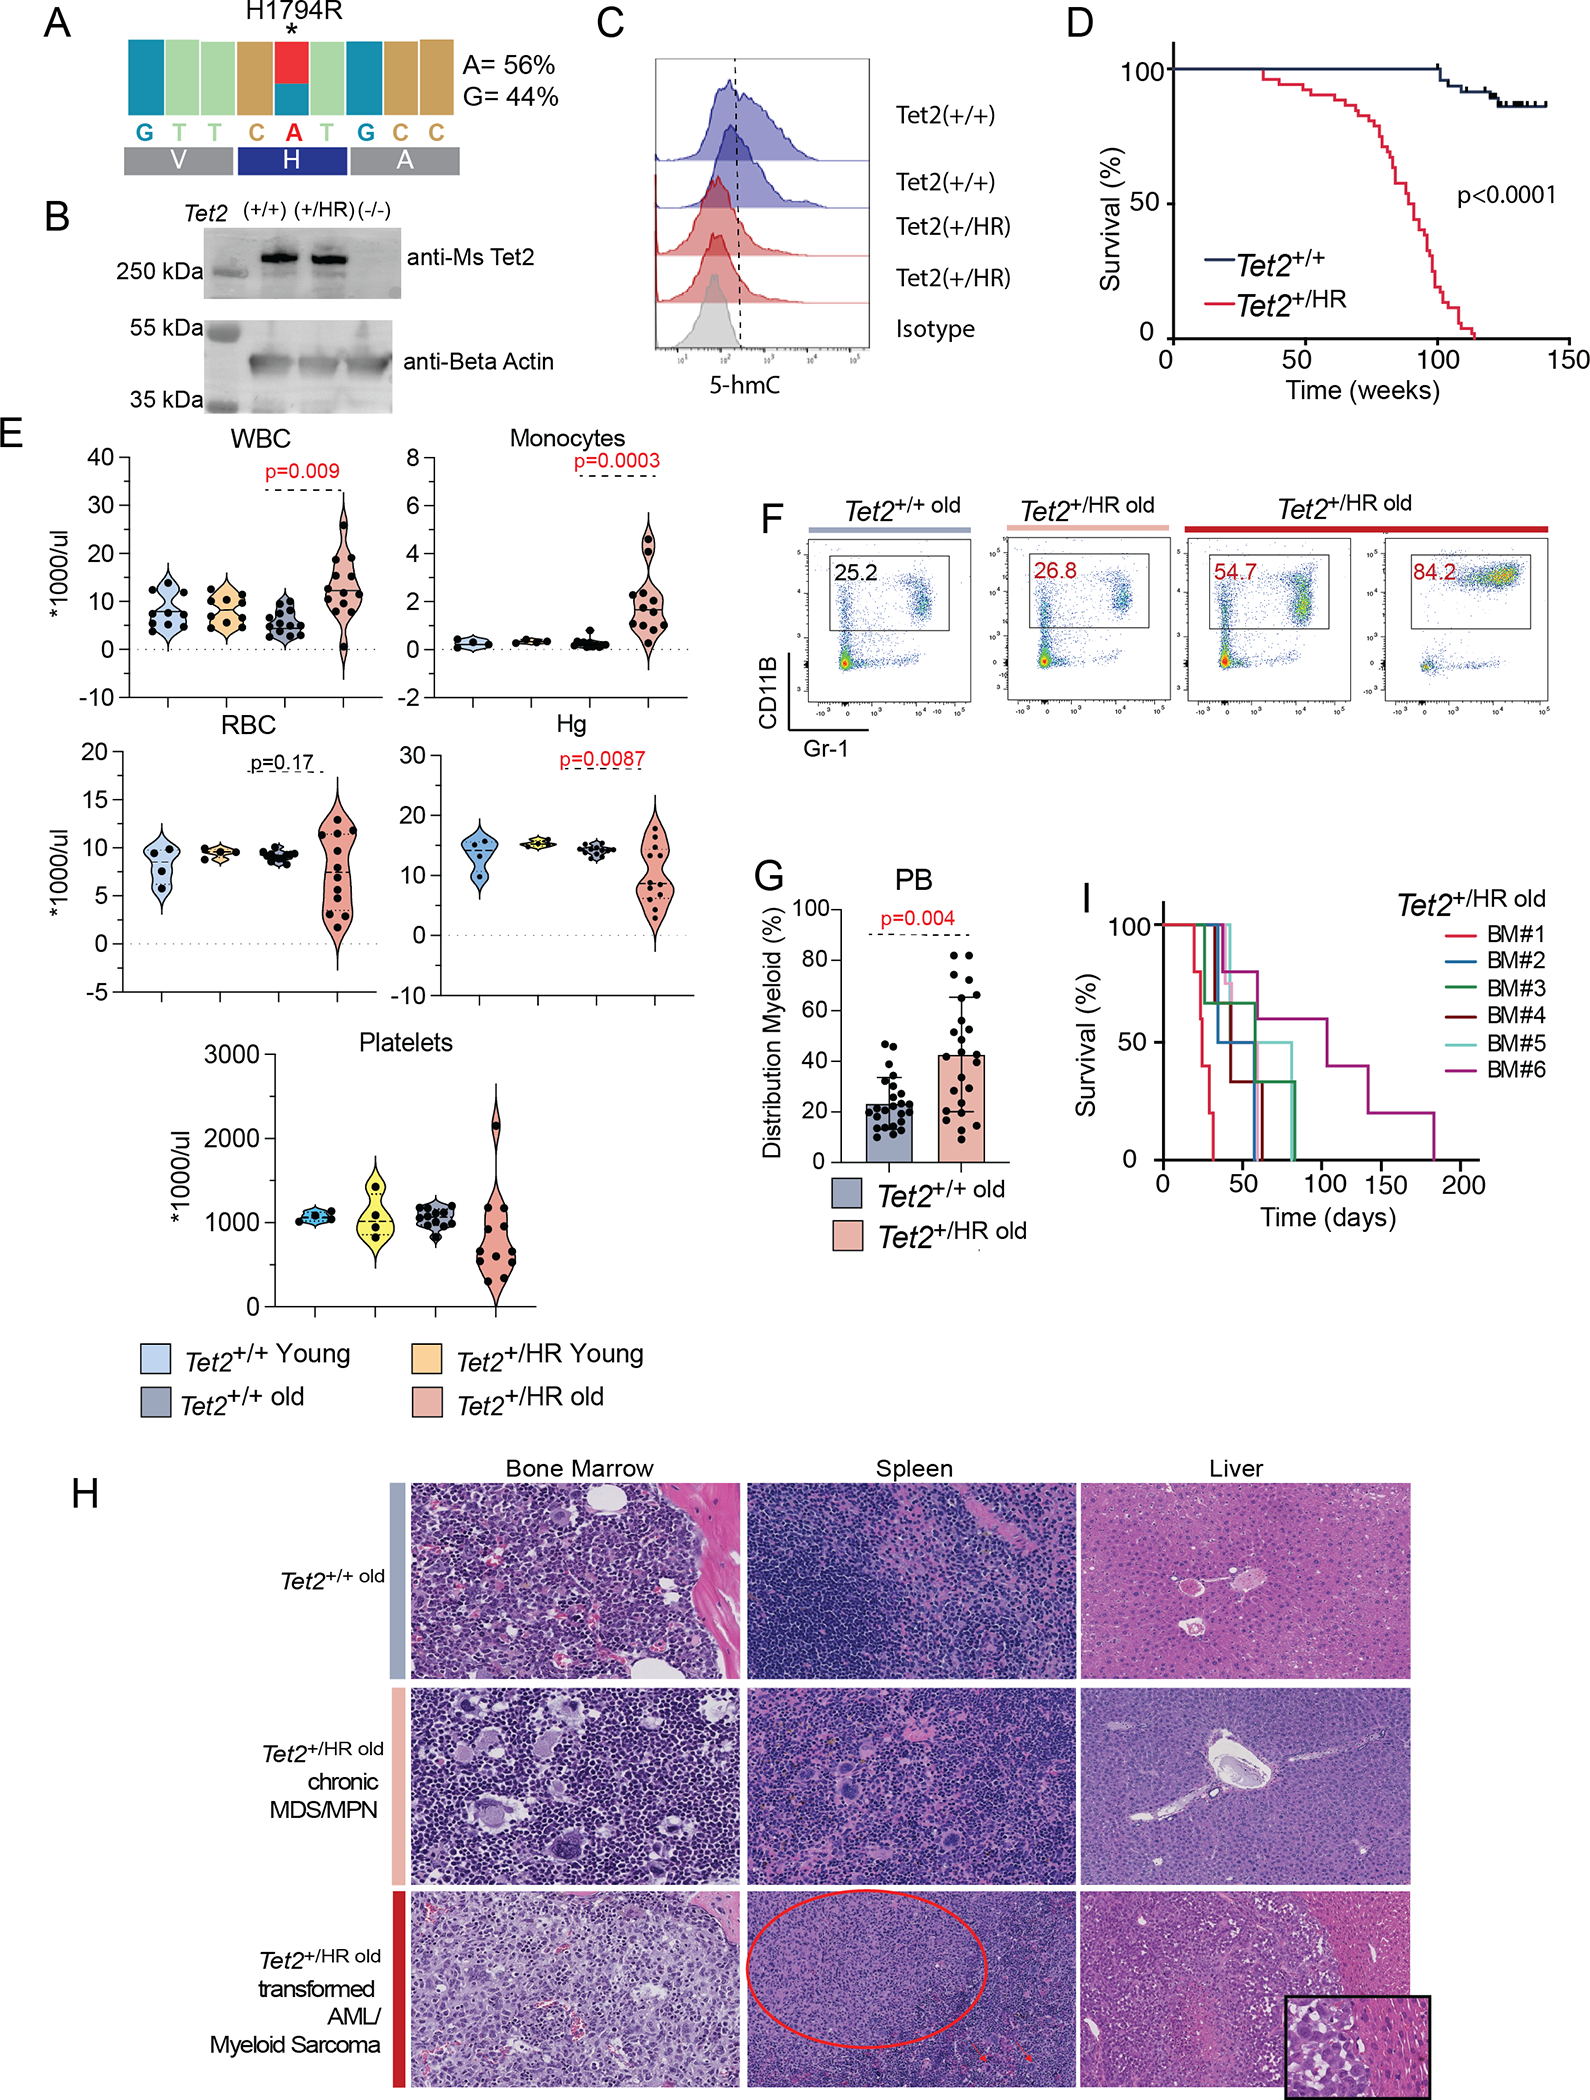
Figure 2. Tet2 H1881R mutation results in a spectrum of myeloid malignancies.

A, Expression levels (measured by RNA-seq) of Tet2 wild-type and H1794R alleles in Tet2+/HR HSPCs (Lineageneg Kit+ cells).
B, Western blot analysis of Tet2 protein expression from Tet2+/+, Tet2+/HR, and Tet2−/− mice bone marrow cells.
C, Flow cytometry analysis of 5hmC expression levels in Tet2+/+ and Tet2+/HR HSPCs (Lineageneg Kit+ cells).
D, Kaplan Meier survival curves of Tet2WT and Tet2HR
E, Levels of White Blood Counts (WBC), Monocytes, Red Blood Cells (RBC), Hemoglobin (Hg) and platelets from peripheral blood samples collected from young and old Tet2HR and control samples
F, Representative flow cytometry analysis plots showing myeloid cell population percentages (Cd11B and GR-1) in peripheral blood of Tet2WT and Tet2HR old mice.
G, Percentage of myeloid cells (Cd11B and Gr-1+) in the peripheral blood of Tet2WT and Tet2HR mice.
H, Top panel: Tet2WT old BM shows orderly trilineage hematopoiesis, spleen and liver. Middle panel: In Tet2HR old, the chronic (mild) phase of disease shows MDS/MPN-like features with proliferation of atypical megakaryocytes and increased myeloid:erythroid ratio; myeloid maturation is preserved. The splenic red pulp is infiltrated by atypical megakaryocytes. The liver was uninvolved. Bottom panel: “transformed” or “severe” disease shows BM involvement by acute myeloid leukemia with sheets of blasts. The splenic red pulp is infiltrated by abnormal megakaryocytes (right half; arrow); in additional nodular aggregate of mononuclear cells is also present, largely replacing normal splenic tissue (myeloid sarcoma); and the liver is also involved by myeloid sarcoma. I, Kaplan Meier curve of sub-lethally irradiated mice transplanted with total bone marrow cells collected from Tet2HR mice with transformed disease.
