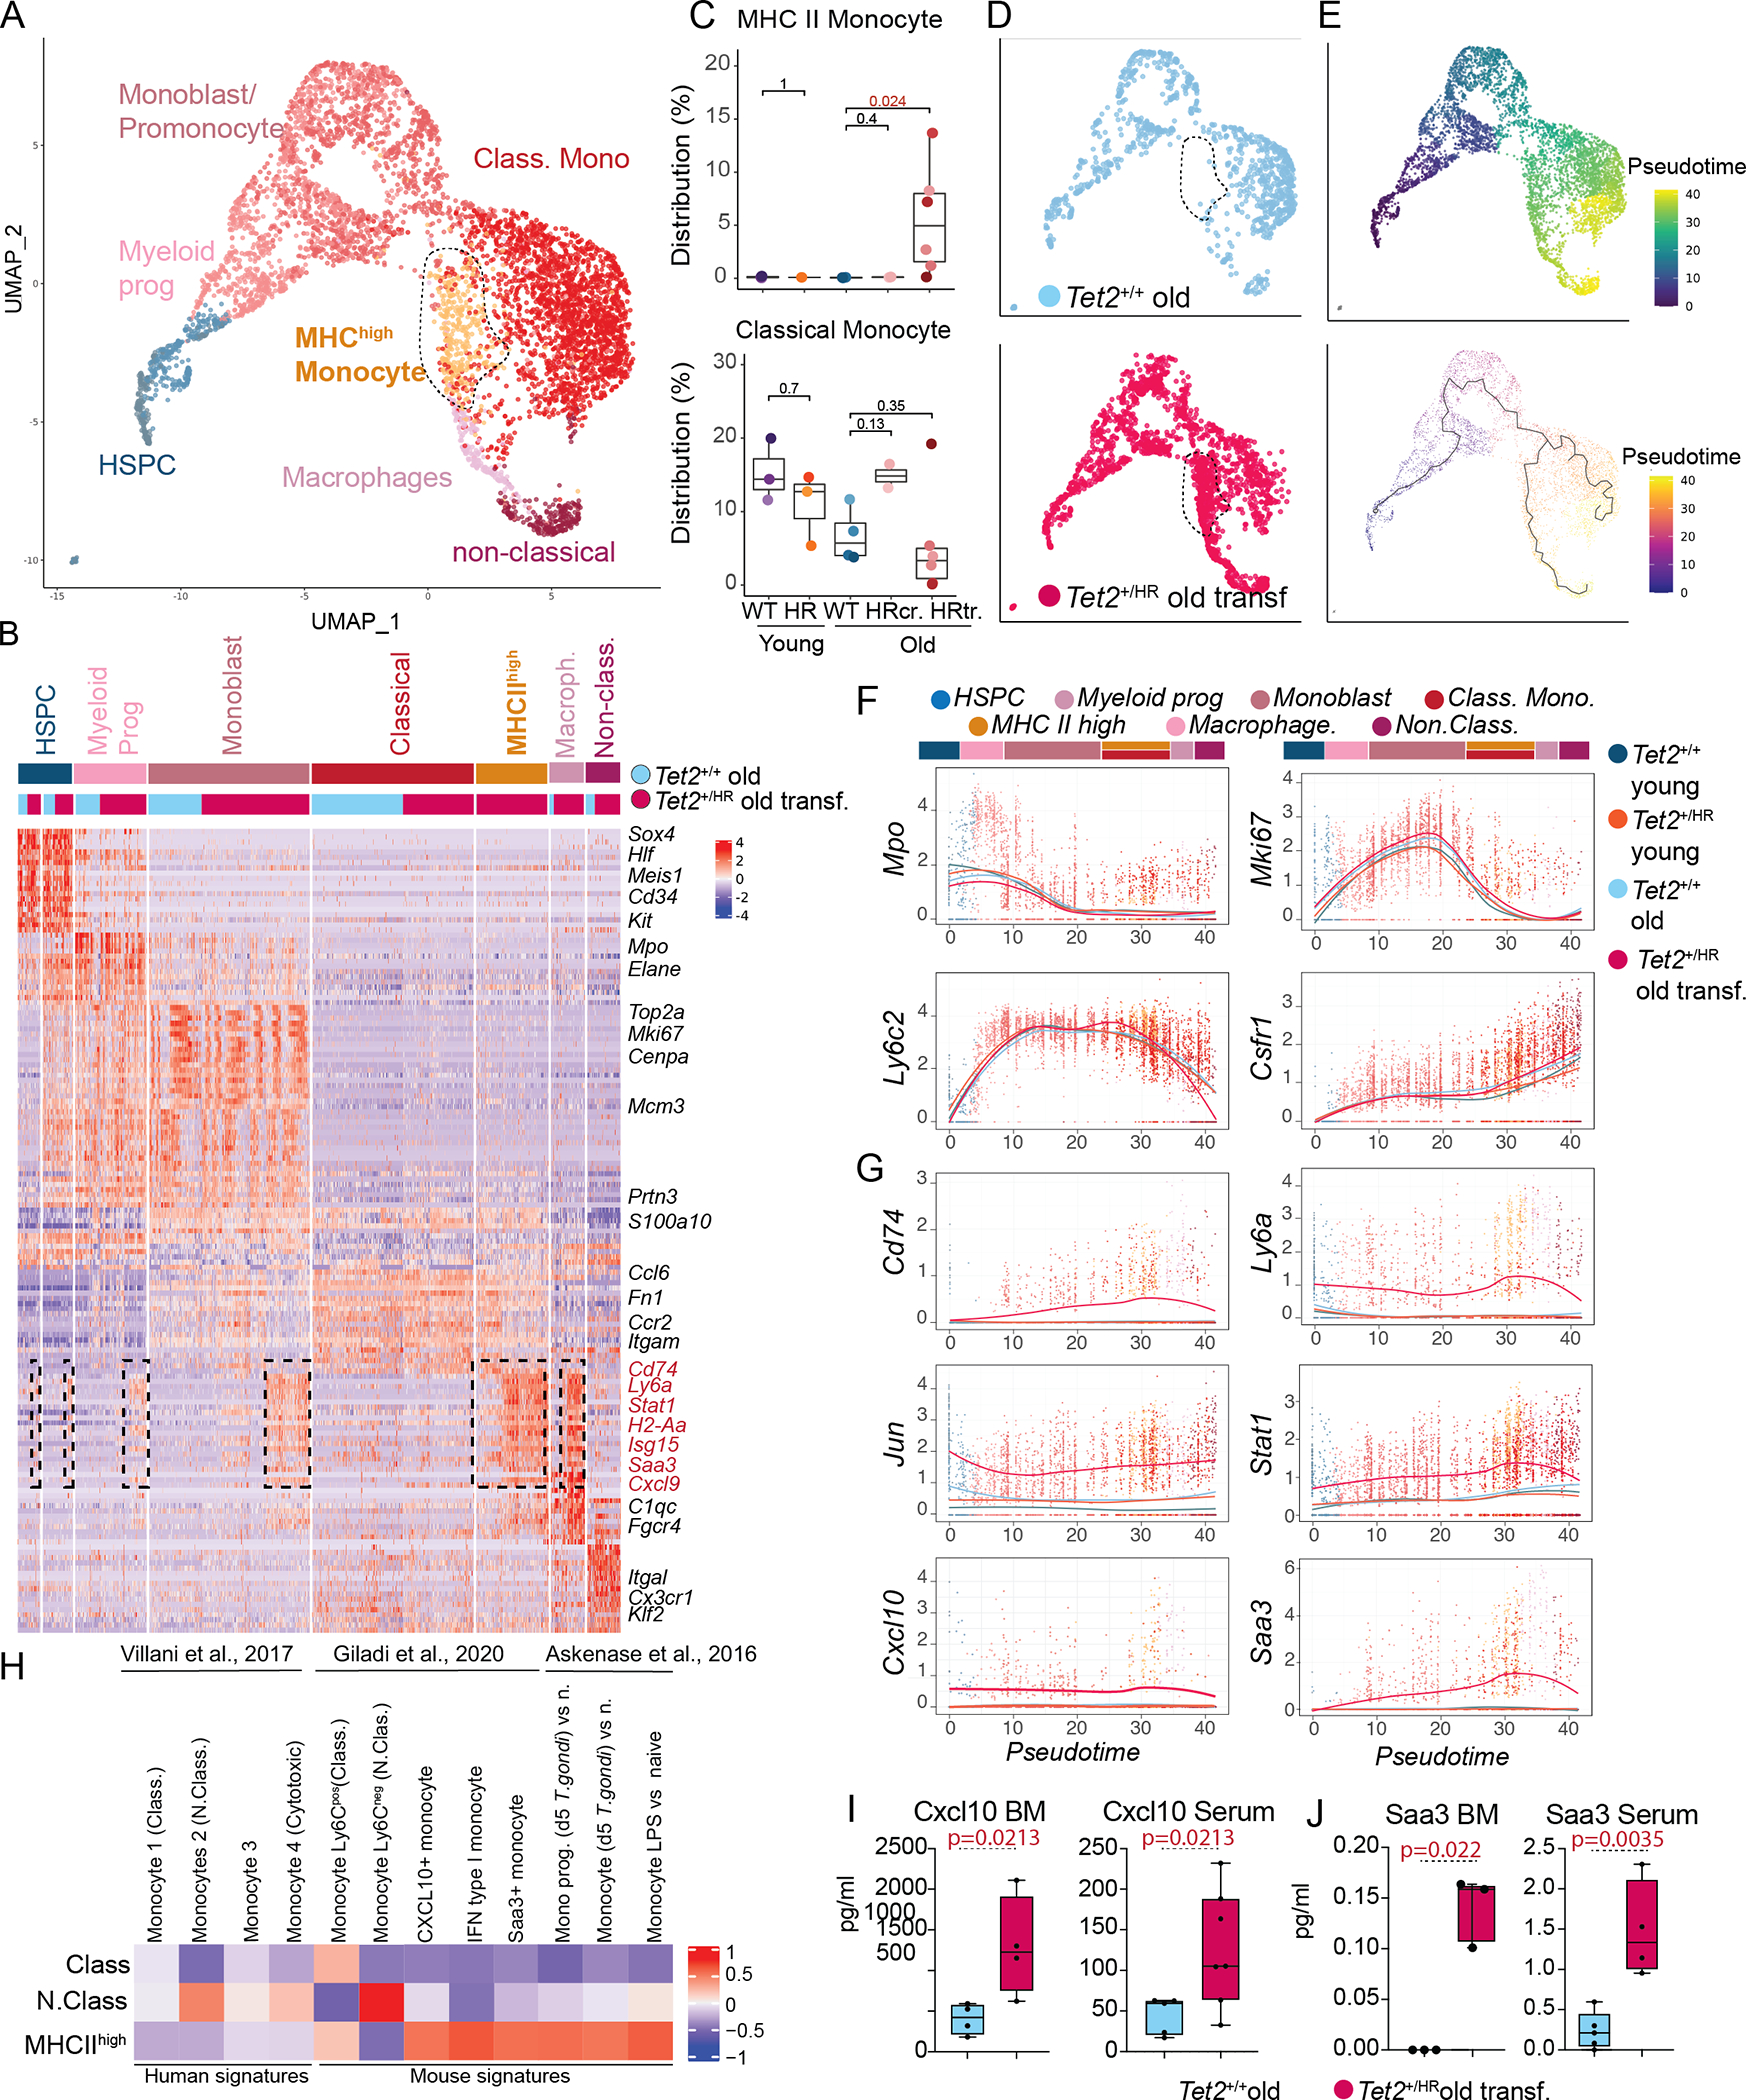
Figure 4. Emergence of an inflammatory monocytic population in leukemic Tet2HR mice.

A, UMAP representation of the indicated myeloid populations (n=5597 cells).
B, Heatmap representing the top 50 genes expressed in each of the indicated populations.
C, Percentage of the indicated cell types in the total bone marrow of Tet2WT young, Tet2HR young, Tet2WT old, and Tet2HR.
D, UMAP representation showing only transcriptomes from Tet2WT old mice (blue) and Tet2HR with transformed disease (pink).
E, UMAP including Tet2WT old and Tet2HR old with transformed disease, color coded by pseudotime (top), and UMAP representation with a principal graph representing differentiation overlaid (low).
F, Gene expression of myeloid differentiation and cell cycle genes along pseudotime. Gene expression for each condition was modelled using local regression (loess) and overlaid.
G, Gene expression of genes high in the MHCII high population along pseudotime.
H, Heatmap GSVA analysis showing enrichment of signatures from published monocytic populations in the classical monocyte, non-classical monocyte and MHCII high monocyte populations.
I, Levels of Cxcl10 measured in the bone marrow fluids and Serum of Tet2WT old and Tet2HR old with transformed disease.
J, Levels of Saa3 measured in the bone marrow fluids and Serum of Tet2WT old and Tet2HR old with transformed disease.
