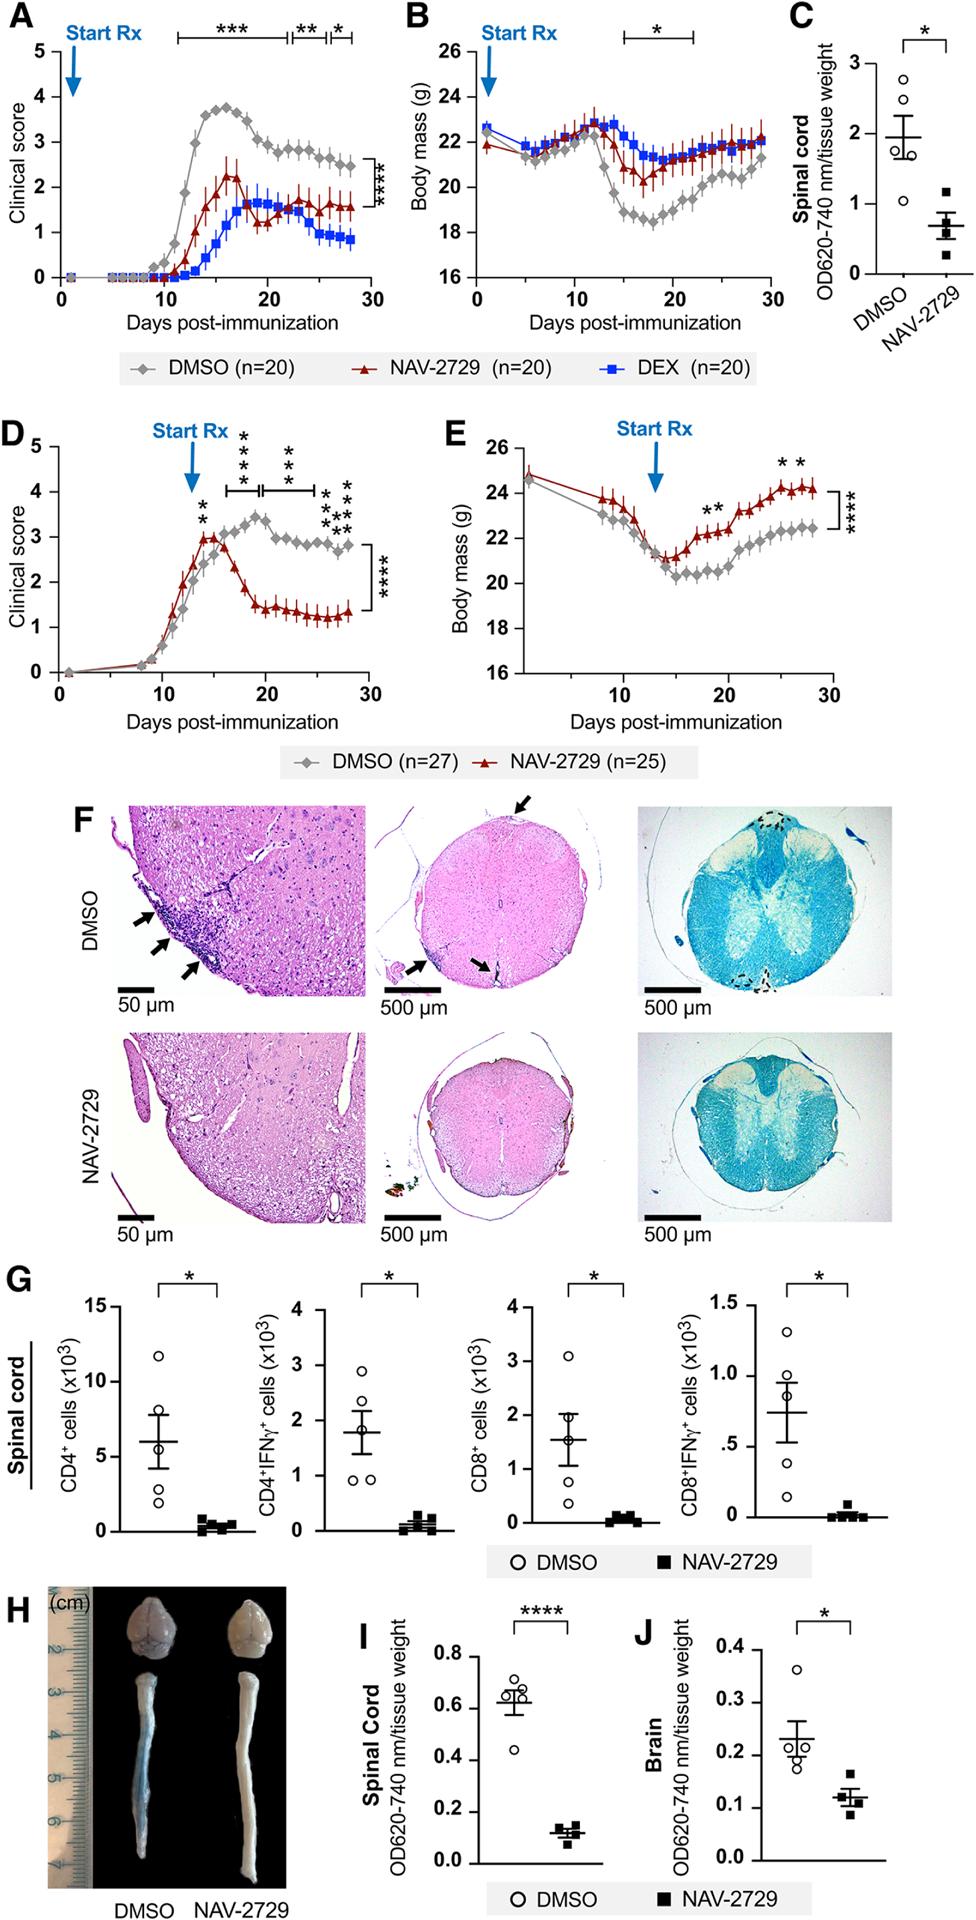
Figure 2. Pharmacologic inhibition of ARF6 reverses symptoms and pathology in MOG-induced EAE mice.

9-week-old C57BL/6J mice were immunized with MOG35–55 to induce EAE. Results shown in panels A and B are representative of two independent experiments and those shown in panels D-E are a composite of three independent rounds of experiments.
(A) Clinical scores in mice treated daily with intraperitoneal injection of the ARF6 inhibitor NAV-2729 (30 mg/kg) starting at day 1 post-MOG immunization.
(B) Changes in mouse body weight over the course of the experiment.
(C) Vascular permeability of spinal cords measured by Evans blue assay at 14 days post-immunization (daily treatments initiated on day 1).
Mice used for panels (D) through panel (J) were all treated daily with intraperitoneal injections of 30 mg/kg NAV-2729 starting at day 13 post-immunization.
(D, E) Clinical scores (D) and mouse body weight (E) over the course of the experiment. Two-way ANOVA with Šidák’s correction for multiple comparisons for panels A, B, D, and E.
(F) Representative spinal cord sections. Left panels show that meningeal and parenchymal inflammation (arrows) in DMSO control is reduced/absent in the NAV-2729-treated mice, 200x H&E. Middle panels show H&E stain, 40x. Right panels show convergent foci of demyelinated white matter (outlined) of spinal cord from DMSO-treated mice. Normal myelination of NAV-2729-treated mice. LFB stain, 40x.
(G) The total number of spinal cord CD4+, CD4+IFNγ+, CD8+, CD8+IFNγ+ T-cells in NAV-2729- and DMSO-treated mice were measured by flow cytometry on day 28 post-MOG immunization.
(H-J) Brain and spinal cord vascular permeability in NAV-2729-treated mice at day 21 post-immunization.
A two-tailed Welch’s t test was used for panel C and the first three graphs of panel G, a Mann-Whitney test was used for the right graph of panel G, a Student’s t test for panel I, and a Mann-Whitney test for panel J. *p<0.05, **p<0.01, ***p<0.001, and ****p<0.0001. All error bars represent the SEM.
Individual symbols shown in the graphs in panels C, G, I, and J represent a single mouse (n=4 or 5).
See also Figures S2 and S3.
