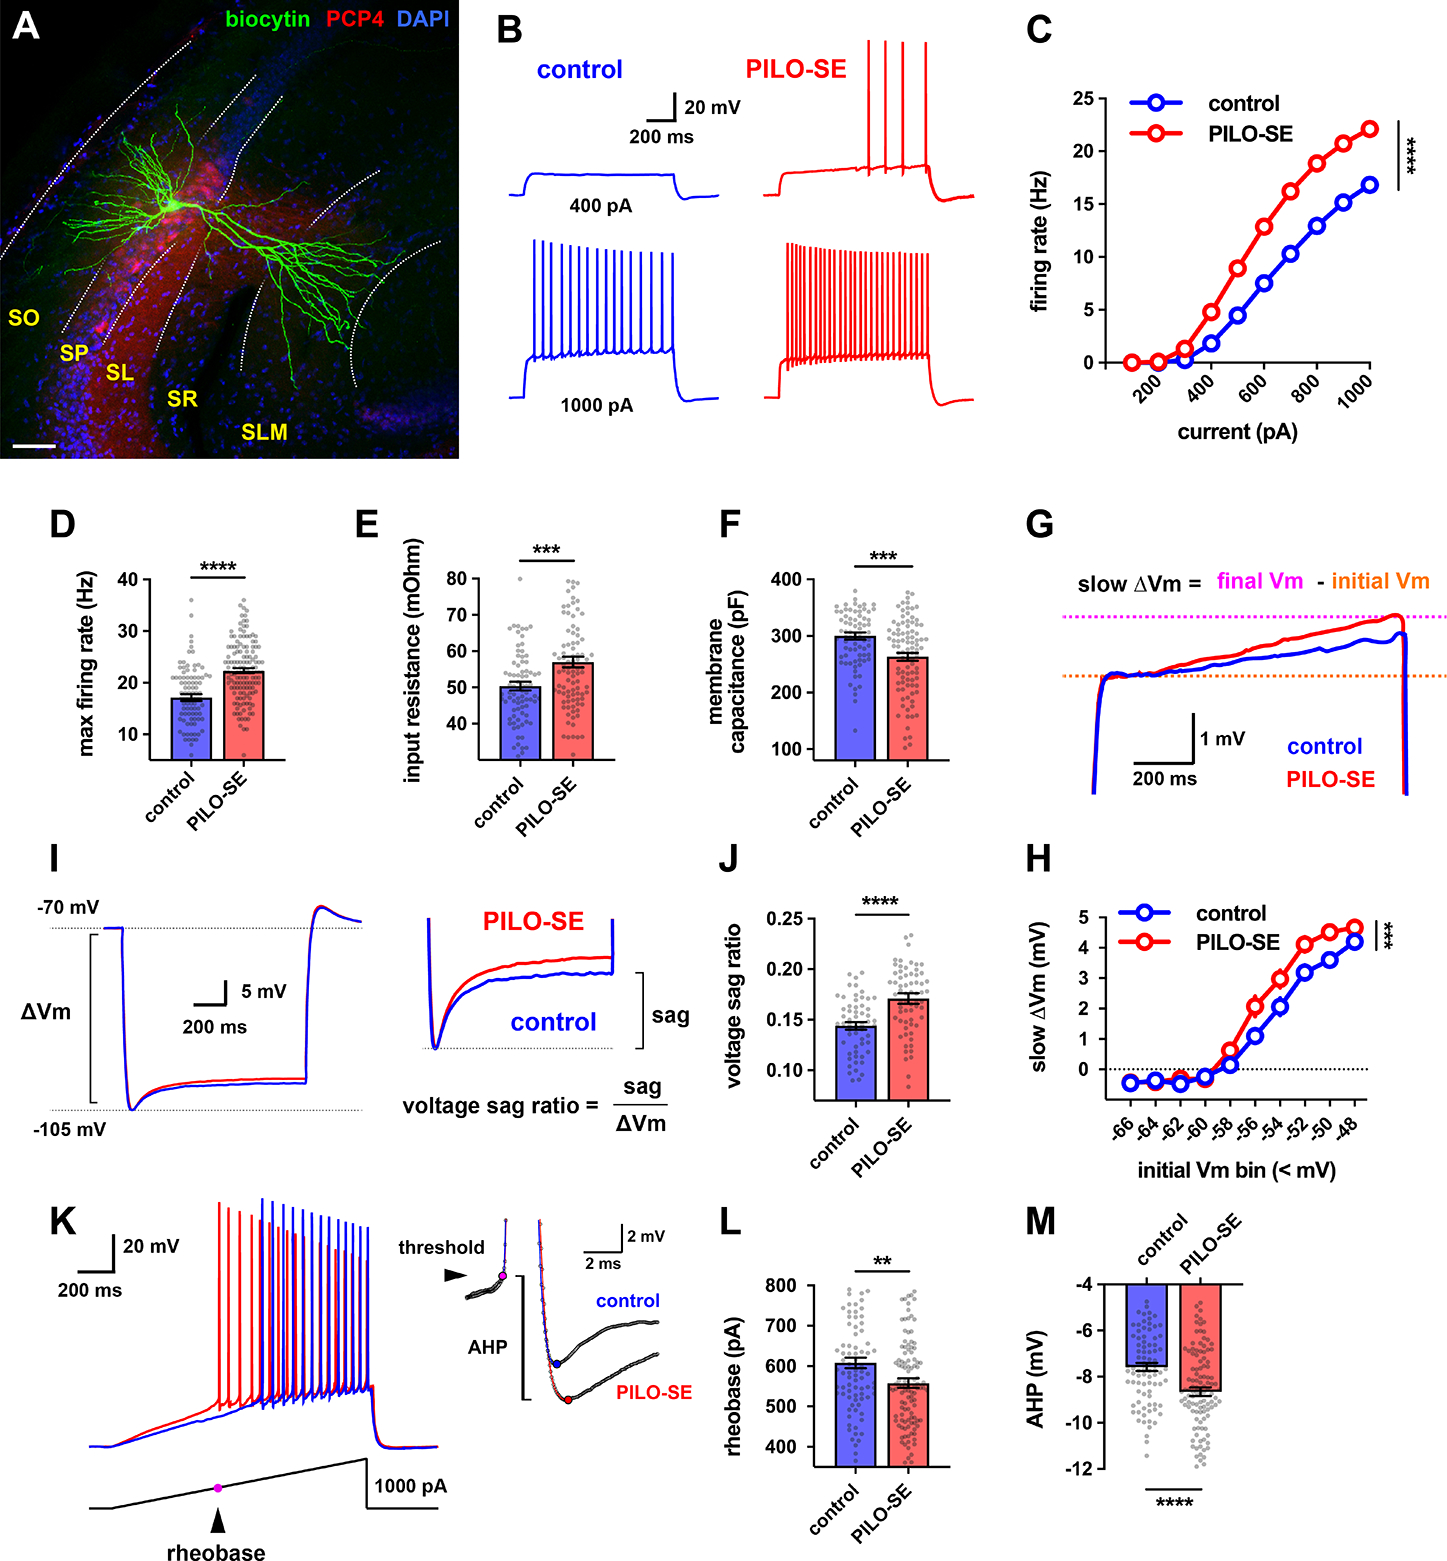
Figure 1. CA2 pyramidal cells (PCs) in slices from pilocarpine-treated mice had increased intrinsic excitability.

(A) A representative hippocampal slice stained for Nissl (blue) and PCP4, which labels CA2 PCs (red), with a single CA2 PC filled with intracellular biocytin (green). The hippocampal layers in this and all subsequent images are labeled as follows: stratum oriens (SO), stratum pyramidale (SP), stratum lucidum (SL), stratum radiatum (SR), stratum lacunosum moleculare (SLM). Scale bar, 60 μm. (B) Representative traces of membrane depolarization and action potential firing patterns in control (blue) and PILO-SE (red) CA2 PCs in response to a 1 second current step. (C) CA2 PCs in slices from PILO-SE mice fire a greater number of action potentials in response to depolarizing current steps. (D) The maximum firing rate was increased in CA2 PCs from PILO-SE mice. (E) Input resistance was increased in CA2 PCs from PILO-SE mice. (F) Membrane capacitance was reduced in CA2 PCs from PILO-SE mice. (G) Representative averaged traces of the slow ramping depolarization exhibited by CA2 PCs near action potential threshold. (H) Cells in slices from PILO-SE mice exhibited a larger slow depolarization. (I) Representative averaged traces from control and PILO-SE CA2 PCs showing hyperpolarization-induced membrane voltage sag. (J) The voltage sag ratio was greater in CA2 PCs from PILO-SE mice. (K) Representative membrane voltage responses from control (blue) and PILO-SE (red) CA2 PCs to a ramp of applied current. (L) The rheobase current was reduced in CA2 PCs from PILO-SE mice. (M) The amplitude of the AHP was significantly increased in CA2 PCs from PILO-SE mice. See also Supplemental Table 1.
