
Figure 2: PK/PD model structure and model fitting results for trastuzumab gelonin cell killing:
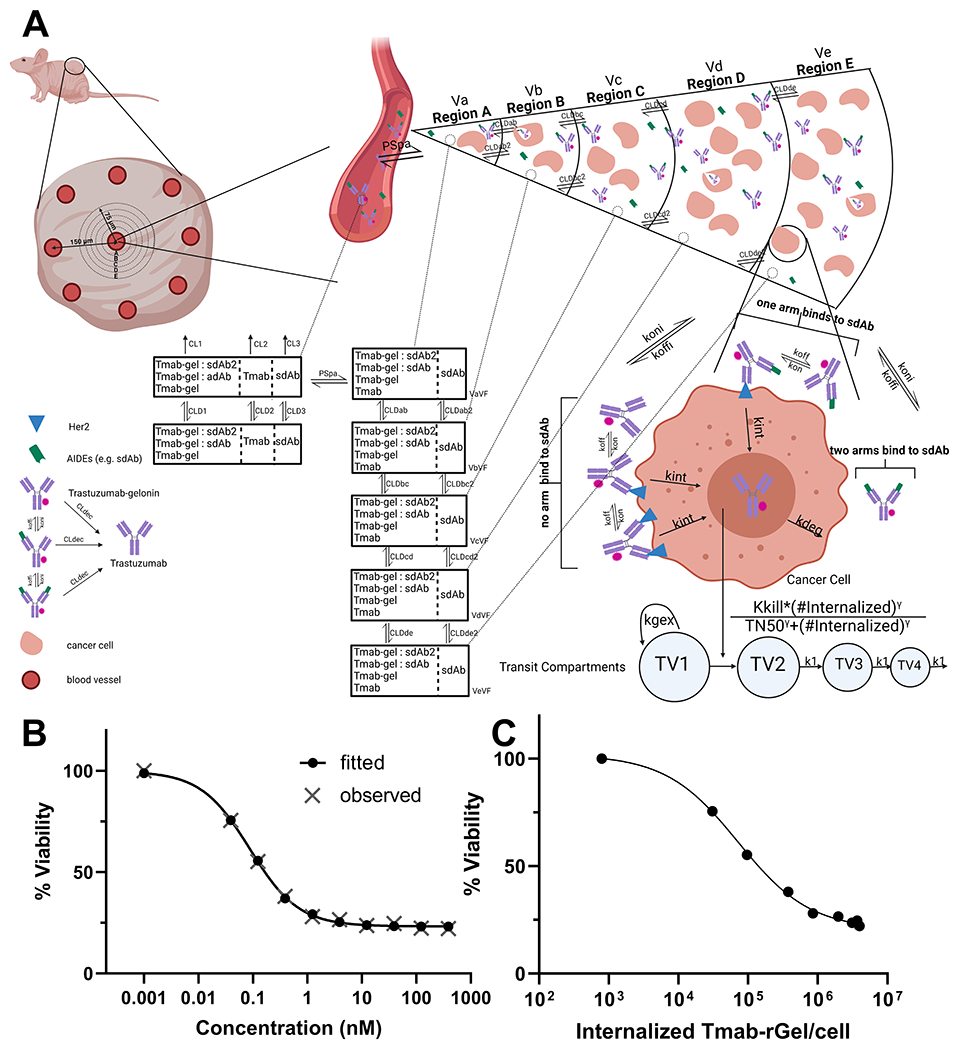
(A) A graphic representation of the sphere PK/PD model structure is shown. A description of the model structure, parameters and assumptions can be found in the methods section, supplementary table 1 and in our prior work (29). (B) Provided is the observed (grey X) and model fitted (black closed circles) cell viability for NCI-N87 cells after treatment with various concentrations of trastuzumab-gelonin. (C) Shown are the model predictions for the number of internalized trastuzumab-gelonin molecules per NCI-N87 cell following treatment with different concentrations of trastuzumab-gelonin.